The design principles of StoCoTo.com and its intended use
Author: Berry Matijssen
Reading time: 12m04s
Updated: 21 Juni 2023
Index
1. Introduction
2. Index and sector comparison: Performance Data
3. Index and sector comparison: Performance indicators
4. Index and sector comparison: Comparison of features
5. Index and sector comparison: Peer group comparison
6. Technical analysis of an individual stock
7. More info on Stocoto.com
1. Introduction
This manual of StoCoTo.com describes the basic design principles behind Stocoto.com and the insights that each histogram or graph is intended to provide. This is not a guide on how to select the most promising stocks or how to identify shares that carry the most risk. The interpretation is up to the user, but using the Stocoto webtool should guide them towards better decision making.
The webtool consists of three parts. The first part where within a selection of stock markets (or more correctly, indexes) a comparison between the listed companies can be made. Secondly, companies within the most populated sectors such as finance or technology can be compared. These sectors are made of the different relevant companies in the selected indexes. Thirdly, for a selection of stocks a technical analysis consisting of a range of indicators plotted against its price over time.
There are four sections in which the comparative analysis for the indexes and sectors are performed. These are:
1) Performance data
2) Performance indicators
3) Comparison of features
4) Peer group comparison
2. Index and Sector Comparison: Performance Data
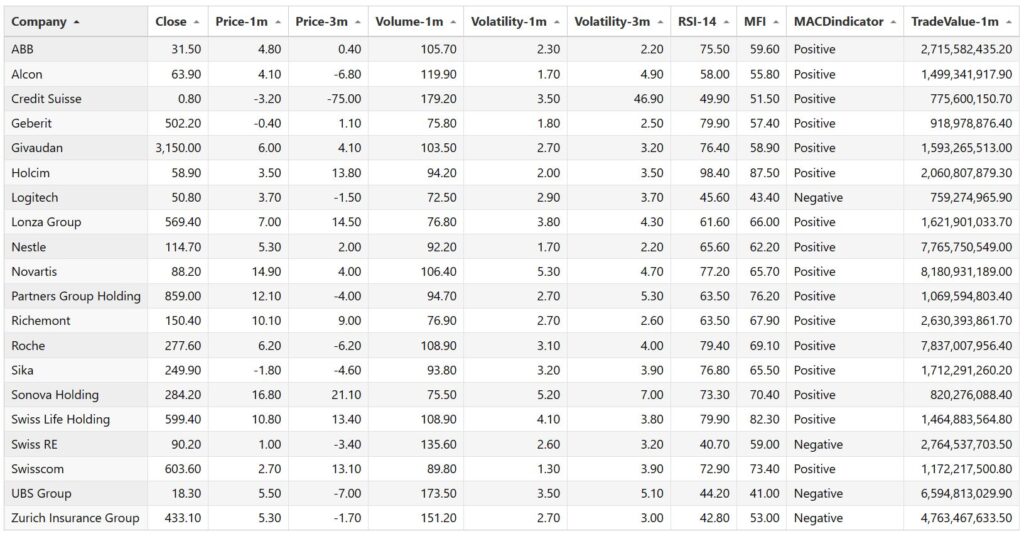
Key points for the performance data-table:
- All data for a stock next to each other is presented in one table
- Allows a quick comparison of features for one stock
- It is sortable on a single property to establish ranking and find the top or bottom performing companies
- Able to sort on different properties to observe the change in ranking
- There are 10 indicators listed in the sortable table
The performance data section contains the table with the key information about price, volume and other derived indicators covering their behaviour over time. These are visualized in the histograms and graphs that follow in other sections. In this table the performance indicators and technical features are listed next to each other for each individual stock.
This allows for a quick comparison of the different indicators for one stock. Hence, comparing price change, volatility and relative trade volume is on the same line. The downside is that numbers are more difficult to interpret, as a histogram or graph provides more visual context.
To enable a form of dynamics to the table the ability to sort for all values in a column has been added. This allows the trader to quickly identify high of poor performing stocks based on the indicator of preference. In addition, sorting on a technical feature such as RSI or MFI allows the identification of stocks that could swing in performance. Additionally, one can sort on a indicator and check where the company of interest is ranked. This is cumbersome and similar to the histograms that are shown but allows sorting on more parameters. Having the ability to play around with these features can provide valuable insights about performance and indication of risk.
3. Index and Sector: Performance indicators
Key points for the histograms with performance indicators:
- The histograms provide a direct view on the spread of each indicator
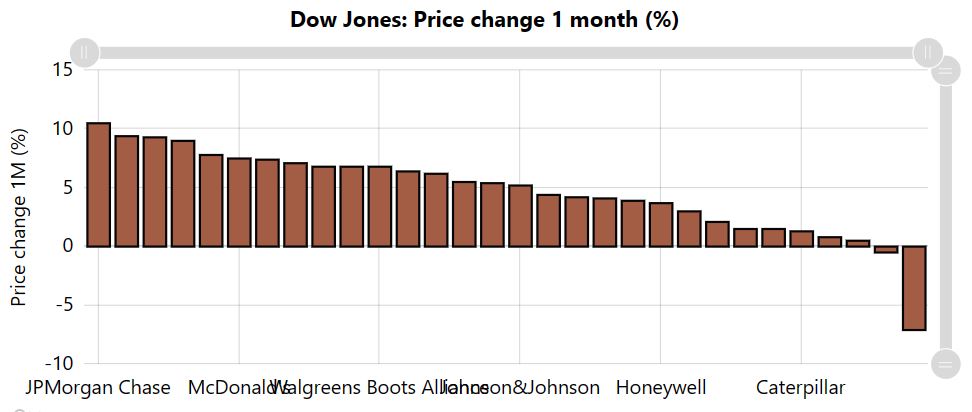
- There are four performance indicators: price change, relative trade volume, volatility and trading value
- Price change to identify growers, moderates and shrinkers
- Relative trade volume to identify ones that are traded heavily and poorly which could turn into a price change
- Volatility to determine risk and stocks for which its volatility could lead to trading profits
- Trading value to determine which companies take up the most capital in trading
The purpose of the performance indicators is to visualize in histograms the ranking of the most important features. This allows to obtain an overall picture to understand if all companies perform the same, if there is a spread over a large range or if there are some companies that are outstanding in either a positive or negative manner. The visualization allows this to do so in a very quick manner.
There are four different performance indicators available. These are:
- Price change over the last month
- Relative trade volume over the last month
- Volatility over the last month
- Trading value over the last month
The price change over the last month provides an indication if the stock has moved up or down in recent time. Although price change itself is what most traders are interested in, it is an outcome of recent activity and valuation. When a trader starts to think about opportunity it could be indicated that high growers can grow more in the future, moderate growers can keep growing at a moderate rate and shrinkers have the ability to bounce back. These are not given, but depending on the opportunity that a trader searches for it gives an indication where to start.
The relative trade volume indicates which stocks are being traded above or beyond average. The two values that are compared are trading activity within the last month and the last year. The whole year is being used as a reference to provide a baseline of traded volume. Using the last month only, it should be able to pick up recent low and high activity. Only combinations of recent periods with low and high trading are missed as they are seen similar to the baseline trading volume. The relative volume histogram clearly provides an indication in which companies trading activity is going on and can be used as a prefilter to select ones for further investigation where the price could change.
The volatility provides an indication of the risk or moveability of a share. High volatility could provide a trading opportunity for a selected stock while low volatility might indicate a more stable stock. Depending on recent developments on the stock market (or its outlook), a trader can choose in which part of the volatility scale one would like to trade or populate their portfolio.
The trading value is an indicator for which companies have been trading the most in the last month in terms of value (money) having changed hands. There is a pattern that in general, bigger companies get traded more as there are more shares available making it more likely that they are traded. This effect is not available in the relative trade volume which as the name suggests compares long-time average to the recent volume. Inspecting the trade-value regularly creates an understanding of the most-traded companies and if they are ranked higher or lower over time, thereby gaining or lowering in popularity. More importantly, if as an investor you are more interested in the largest companies this histogram can be used directly as a filter to select for example the largest five companies within an index. This histogram is not available for the sectors as these consist of different currencies making them more difficult to compare.
4. Index and Sector: Comparison of Features
Key points for feature comparison:
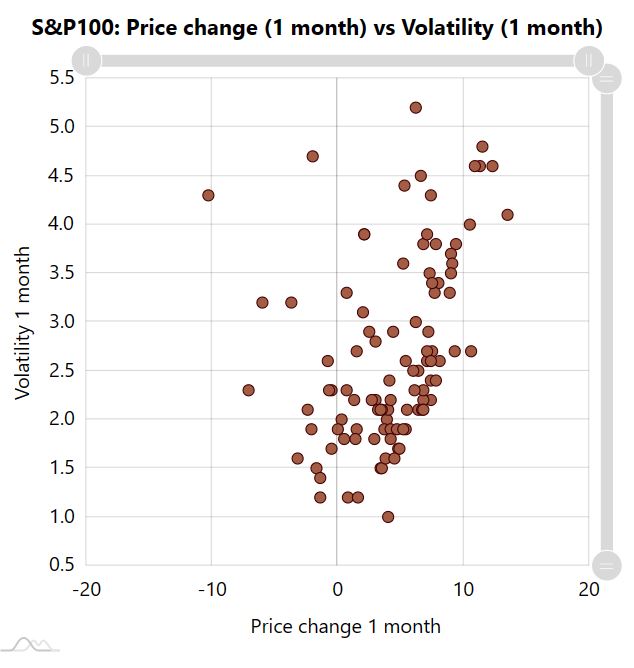
- The price change (1 month) vs volatility (1 month) shows if the price has been moving in the last month.
- The price change of 1 month versus that of 3 months indicates if the recent price change is similar or differs with a longer trend.
- The price change versus relative trade volume indicates if the resulting price change is caused by above average trading.
- The volatility of 1-month and 3-month are compared to determine if a price change was in the past or now and if it ongoing.
- The volume versus volatility is intended as an indication of price change without taking into account the direction of the price move (up or down)
- The RSI vs MFI plot is intended as a dual-parameter technical indication if a stock should be purchased or sold.
- The distance to minimum vs relative position is intended as a risk indicator for a stock.
- The price volatility vs money flow volatility is to understand if changes in the money (volume * price) are in line with the observed price change.
There are eight XY-graphs available in which different performance indicators plotted against each other. These are:
- Price change (1 month) vs volatility (1 month)
- Price change (1 month) vs price change (3 months)
- Price change (1 month) vs relative volume (1 month)
- Volatility (1 month) vs volatility (3 months)
- Volume 1 month vs volatility (3 months)
- RSI (14 days) vs MFI
- Distance to minimum vs relative position
- Price volatility vs money flow volatility
The price change (1 month) vs volatility (1 month) indicates if the price has been moving in the last month and if the resulting outcome is an increase or decrease in price. It is also possible that the price has moved significantly in the last month but ended up at its starting point. This would show a moderate price change, but higher volatility.
The price change of 1 month versus 3 months indicates if the recent price change is similar or differs with a longer trend. For example, if both are increasing it could be considered that a growing trend is continuing or if the 3 months results in a decrease and the 1 month shows growth, a reversal could happen. This is not an exact science as both numbers indicate the performance over a defined time period while there can be significant shift over a few trading days. Therefore, combining this view with volatility creates a more insightful view.
The price change versus relative trade volume indicates if the resulting price change is caused by above average trading. Additionally, it can be identified if prices change while trading was low. It is clear that the relationship between price and volume is not a direct one. By comparing both on the same timescale of 1 month gives a fair indication of the effect of recent trading activity on its price.
Volatility is calculated in two variants: 1-month and 3-month. By comparing these two an indication can be obtained if short-term price movement is similar to medium-term price movement. There is a high similarity to the price change over one or three months. However, the price can go up and down resulting in no noticeable gain while volatility would in that situation be high. Therefore, it is not an indicator of price gain or loss, but how much it has moved recently. Stocks with low volatility could be considered stable and both time periods having high volatility provides possible opportunities for trading. The other combination where one value is high and the other is low indicates that is has suddenly moved or after a volatile period has become stable. The challenge with volatility is that sudden changes can create high volatility without any indication about its future behaviour. In addition, it is well possible that the one-month and three-month volatility work on a different scale, hence comparing these numbers directly to each other might not be a valid approach.
The volume versus volatility is intended as an indication of price change without taking into account the direction of the price move (up or down). A trader could expect the price to change after a higher volume amount is traded. Volume is because of one person selling and the other one buying. However, the driver behind it can be different. A positive development could lead to a higher volume driven by the demand side, while in reverse, a negative development could lead to a sell-off and another trader willing to buy it at a lower price. This link is not always clear and by comparing volume and volatility a comparison could be made if higher trading activity leads to price changes (volatility). Depending on the interest one could select stocks for further interest which from the combination of high volume with high volatility or high volume with low volatility. Other combinations such as low volume with high volatility could also be of interest, while low volume with low volatility could possibly of interest of their steady position in share portfolios.
The RSI vs MFI plot is intended as a dual-parameter indication if a stock should be purchased or sold. They are slightly different as RSI is based on price and MFI is based on both price and volume. Therefore, the resulting numbers will be different. The interpretation is similar. A value of below 30 indicates oversold and above 70 overbought. A stronger signal would use values of 20 and 80. Although this does not guarantee profitable trading, by comparing these two indicators a more reliable signal could be obtained and a better selection can be made to investigate a particular stock further.
The distance to minimum vs relative position is intended as a risk indicator for a stock. The distance to minimum indicates how far (in percent) is away from its minimum in the last year. If it is 20% then its price could drop by 20% to reach its minimum of the last 12 months. The relative position indicates where it is on the scale of the last year. A value of 100% means it is currently at its top, while a value of 0 means that it is at its lowest of the year. A value of 50% means that it is halfway between the low and high of the last 12 months. This plot can also be used to identify stocks that have grown consistently and remain and are currently at its highest price.
The price volatility vs money flow volatility is to understand if changes in the money (volume * price) that is used to trade stock of a company are in line with the observed price change. The time period is 1 month for both measurements of volatility. If a price changes sharply without a change in money flow or the price remains stable but money flow volatility is high there could be an upcoming change in price (positive or negative).
5. Index and Sector: Peer Group Comparison
Key points for peer comparison:
- The features price change, relative volume and volatility are selected to indicate the main behaviour of a selected index or sector compared to all others.
- Strong growth could be due to the overall market growth, strongly performing companies or a sector that is growing fast. These can be identified using price change peer comparison.
- Indexes or sectors that are traded above average can be identified using volume peer comparison.
- More volatile indexes or sectors do not necessarily result in a price change over a month or higher trading. Volatility offers opportunity for investment or indicates risk which can be located using volatility peer comparison.
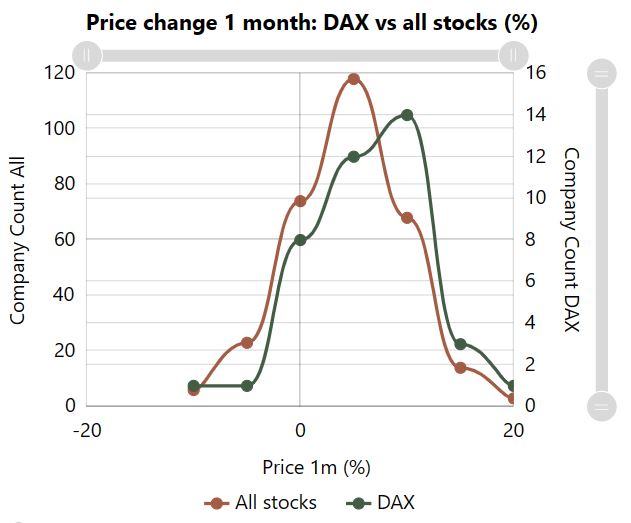
There are three peer group comparison histograms available in which a single property compares the index or sector to all stocks. The main principle for the choice of these indicators is that they provide a key understanding of the overall performance. The other indicators are all derived from price and volume and their behaviour over time. These features are:
- Price change (1 month)
- Relative volume (1 month)
- Volatility (1 month)
Comparison of price change provides an indication if this index or sector is outperforming or underperforming compared to all other listed companies. An index contains a range of companies that are active in different sector and have different growth trajectories. This means that an outperformance could be due to (1) a market performing well, (2) containing many companies that grow strongly or (3) a sector that is growing fast being well presented in an index. Using the price change peer comparison graph will provide clearer insights for each sector compared to the indexes.
Relative volume shows if this index or sector is more actively traded than the rest. For the indexes this is less likely to happen because of its diversity in shares. However, when one stock market is weighted more towards a certain sector it could change. In contrast, sectors can see significant higher trading because of trends in the economy which can cause a certain sector to gain positive attention or fall out of favour.
The volatility peer group comparison shows which markets or sectors are currently undergoing more price changes. A more volatile market provides more opportunities for trading as stocks can be overbought or oversold. In contrast, when the overall sentiment is highly volatile an index or sector that is less volatile could be of higher interest to potentially lower the risk.
6. Technical analysis of an individual stock
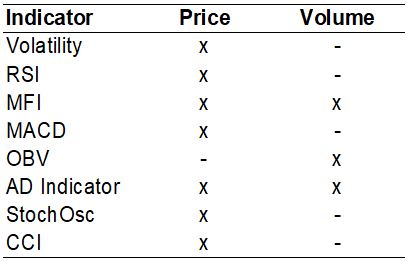
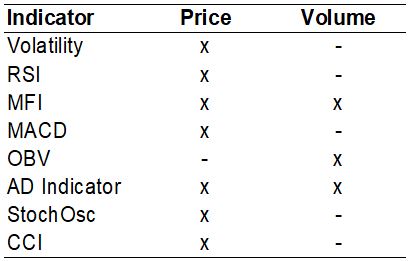
For a selection of stocks (StoCoTo Selection) a technical analysis is available. These are indicators plotted over time in which they are compared to the share price. These indicators are Volatility, Relative Strength Index (RSI), Money Flow Index (MFI), Moving Average Convergence Divergence (MACD) and On Balance Volume (OBV). Together they form a view in which price and volume behaviour over time are analysed, compared and insights can be derived. Some of these are lagging indicators, while others are intended as leading indicators. A unique feature of stocoto.com is that they are all visible when the page is loaded and a quick scrolling down the page moves to the next one. This makes deriving insights from behaviour of stock price and volume much faster than comparable (software) tools where each feature has to be clicked first.
There are any technical indicators available and visualizing all of them in one view provides a powerful and fast insight into the current state of a share. There are many indicators available in literature and a good practice to use them effectively is to make a selection. The principle behind many of them is similar and using too many could lead to significant misunderstandings. For example, if too many variations of the same indicator are used, this could give the impression of a strong signal. In reality, the same signal is displayed in different ways while fundamentally it sends the same message. Furthermore, too many indicators unnecessarily complicates the analysis. All of them are based on price and volume over time which has its limitations on the insights that can be derived from it. Therefore, a selection is made to cover ones that are derived from price, volume or both. Furthermore, they can be subdivided into lagging or leading indicators although it should be noted that the distinction between both is not always clear.
The following technical indicators are available on StoCoTo.com:
Volatility: Volatility is a statistical measure of the variation in price over a selected time-period. It is used to determine the risk and potential opportunity for trading.
RSI: a momentum indicator based on price. RSI is intended to measure the strength and weakness of the market and calculates the speed and magnitude of recent price changes of a stock. It is used to evaluate if a share is over- or under-valued.
MFI: a momentum indicator and technical oscillator that uses price and volume (combined: the money flow) to measure the enthusiasm of the market. It is used to identify overbought or oversold signals.
MACD: a momentum indicator that shows the relationship between two moving averages of a share price. It is used to identify if a share is overbought or oversold by assessing the strength of the directional move.
OBV: a momentum indicator that uses volume flow to indicate if a price change is driven by volume. It is used to identify mismatch between volume and price which, when it occurs, indicates an upcoming price change.
AD Indicator: and indicator that uses volume and price changes within a trading day to determine if a stock is being accumulated or distributed.
Stochastic Oscillator: an indicator that attempts to confirm the theory that in an upwards price trend the closing price will be near the high, and in a market that moves downward the closing price is near the low. Divergence between both indicate a trade signal.
CCI: an indicator for momentum that evaluates price trend direction and strength and when the pattern changes suggest a trade signal.
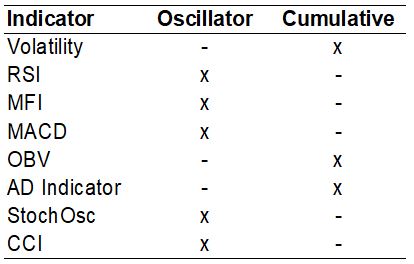
The theory behind lagging and leading indicators is that lagging provides information about the past, while leading indicate a future change. Because a stock market is notoriously difficult to predict it can be considered that the leading factor only indicates a higher likeliness of a change to happen. All of the indicators are based on historical price and volume there is always a part of lagging in there. The leading value is often extracted by an unbalance between price and volume or a recent change that is larger than what has happened on a longer timescale. These differences will lead to a price change which is referred to as overbought (and price could lower) or oversold (and price could rise).
Each technical indicator can take a different form. These can be subdivided into two groups: oscillators and cumulative functions. The oscillators are more straightforward to interpret. They mostly operate on a scale of 0 to 100. This is accompanied with thresholds like 20 and 80 to identify oversold or overbought levels. The main advantage is that they are straightforward to interpret. This in contrast to cumulative functions which do not have reference values. These can take on a variety of values with no direct link to each other. Hence, the interpretation often lies within the change of trend in their relation to price or historical values. The interpretation is therefore more challenging and a comparison to other stocks or history is difficult.
Technical indicators are known for providing unreliable signals. This is largely due to their simplicity and the assumption that recent price and volume changes indicate future changes. The two most common misinterpretations are false signals and trend continuation.
A false signal is when an indicator reaches a threshold signalling overbought or oversold, but no price change occurs and the technical value return to normal without a price change. These happen regularly. A trend continuation such as a price increase is often preceded by an overbought signal. However, a price breakthrough through a ceiling can happen if enthusiasm for a share continues. In this case the technical indicator will return to below the threshold once a new normal has been reached. In this case the signal is not completely wrong as an event (the breakthrough) did happen.
The value provided by technical indicators is not that of an exact and reliable indicator of a price change but is better considered an early warning signal indicating a high chance of a price change. This signal should be investigated further and an assessment about future risks and returns can be performed. Based on the newly obtained view of a company a decision can be made to buy, sell or hold its shares
7. More info on Stocoto.com
Comparison of stocks
– Markets
– Sectors
Articles about technical indicators
– A/D indicator
– CCI
– MACD
– MFI
– RSI
– OBV
– Stochastic Oscillator
– Trade Volume
– Volatility
Stocoto.com provides a tool to get more insights into stock performance. However, stocoto.com does not give advice and it is adviced to use additional resources. It is up to the user to make a decision which stock to buy or sell. The price of a stock can increase or decrease.