The stock comparison tool (StoCoTo) is an intuitive platform that turns data from stock markets, sector and individual listed companies into insights. To make it intuitive and straightforward all information and derived features are displayed in graphs. This allows a quick identification of insights, opportunities and treats. Use the links below to view all relevant analysis and insights.
StoCoTo is working fine. Enjoy the analysis of stocks!
Last data refresh: 31 July 2026 – 20:48 C.E.T. (Amsterdam, Berlin, Paris time)
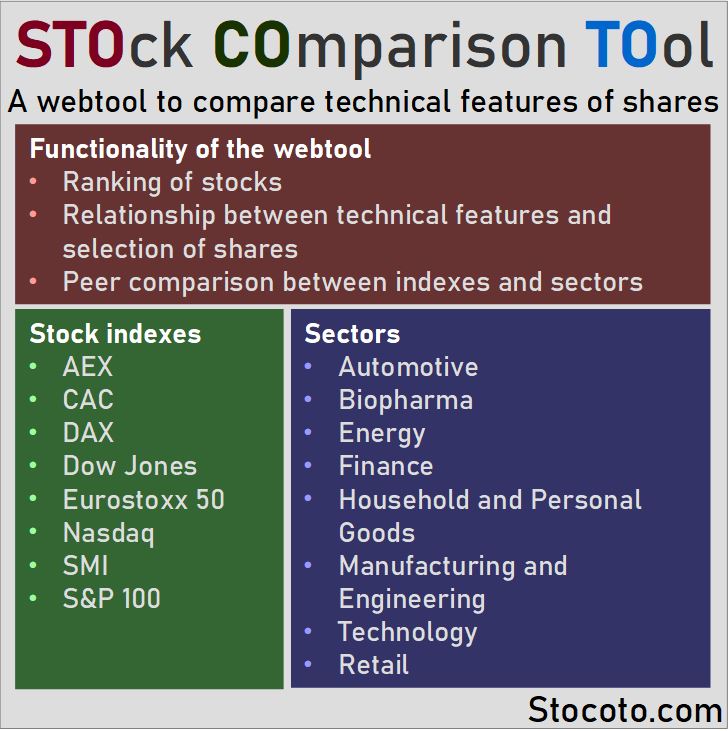
The STOck COmparison TOol is a free data analytics platform designed to compare stocks and cryptocurrencies using performance and technical features based on share price and volume. Included are four European indexes (AEX, CAC, DAX, SMI) and three American indexes (Dow Jones, S&P100, NASDAQ). For eight sectors (automotive, biopharma, energy, finance, household and personal goods, manufacturing and engineering, retail, technology), the relevant stocks are selected and combined into a comparative analysis. A special group of stocks is created by selecting the most traded or noticeable into the StoCoTo selection index. To complete the product line, a comparison of cryptocurrencies is available. The visualization of the comparisons provides insights into market performance, identifies potential trading opportunities, assessment of risk, or performs a peer comparison (benchmarking) of the index or sector to the total available stocks.
For a selection of companies and crypto, a deep-dive into price and volume over time is available in the shape of an analysis based on technical features such as AD, MFI, MACD, RSI and the Stochastic Oscillator. All features are visualized using interactive histograms and charts with (where possible) reference lines provided. The StoCoTo.com platform offers a unique way of viewing stock market data that allows the trader to pre-select shares that can be suggested as opportunities or provides an understanding of risk and can make up an essential part of a trading strategy. Types of trading strategies that this free online stock analysis tool is suitable for (but not limited to) are momentum, technical and swing trading.
Blog! A reflection on the placement of candidates in the Eurovision Song Contest 2025
Last year I gave some insight on the Eurovision Song Contest and suggested there are three rules that make the Jury and organizers pick the winner. This year, these rules were applied exactly making Austria the winner.
Previous articles were on predicting the outcome of the Eurovision using social media, finding the best fragrance, partner availability by age, cost of manufacturing a car or a different look at blockbuster drugs.
Compare stocks with technical features
Comparing stocks is a challenging task, but can be achieved using the standard metrics price change and trade volume over time. From these two, a range of features such as technical indicators (volatility, money flow, short/medium price performance, MFI, RSI) can be derived. This webtool allows the comparison of the stocks in different indexes and sectors using easy-to-interpret graphs and histograms.
Analysis of shares provided by the webtool
A set of analysis is available for each index or sector. The structure is the same for all. The pages for the individual companies have a different structure focussing only on technical analysis. The link for each section provides an explainer handout.
- Data overview – A table that contains the most important values that are used in the analysis of each stock.
- Index/sector performance overview – A ranking of traded companies to understand which have shown the best price growth, trade activity, volatility or money flow.
- Performance insights – An overview of the recent price changes an trade activity (volume) to understand how a selected stock is performing and providing a reference by comparing it to other companies in the same index or sector.
- Trading opportunities – Four comparison of stocks based on technical indicators and price movement to identify opportunities to pre-select stocks that are a buy or sell.
- Understanding risk – An understanding of the current price in relationship to recent price movement and its high/low of the previous year.
- Peer comparison – How does an index or sector perform compared to all other stocks. A potential first step before focussing on individual shares.
- Technical analysis – Graphs that show technical indicators such as MFI, MACD, Stochastic Oscillator, etc over time for individual listed companies.
Feedback from our users
“My experience with the stock comparison tool has been very positive. It introduced me to using analytics to find stocks of interest. A great starting point to pick out stocks to learn more about and possibly invest in. I also appreciate the link to Yahoo finance.” – Mike Connor, United Kingdom
“What I like most about stocoto is that I can get an overview of all stocks first and then dive deeper into them using the technical analysis. The graphs clearly help as well because many other websites provide tables that need to be clicked on first before I find what I am looking for. This makes the experience a lot faster.” – Kate Hudgins, USA
“In comparison to other sites such as tradingview.com it has less data. This actually works as a benefit as only relevant data is shown and all displayed on a single page, It makes it much quicker to navigate and find some interesting companies.” – Markus Friedrich, Germany
“The one thing I like most is that the technical analysis has all graphs below each other, making it quick to scroll through and observe or compare patterns. Saving a few clicks makes me want to come back more often.” – Claude Leroy, France
Analyse the leading stock markets of Europe and USA
There are eight stock markets available for comparison and analysis. They represent the majority of the largest and most traded listed companies in North America and Europe. The selected indexes are:
In addition, a selection of companies has been made from each stock market based on their trade activity and relevance. These are grouped in the ‘StoCoTo selection’ and will for most traders represent the main stocks of interest. All of the companies in this selection have an individual technical analysis available.
Focus on comparable companies by choosing any of the eight sectors
There are eight company sectors available on the analysis platform. Many alternative sectors contain few stocks making their analysis irrelevant. Therefore, only the ones are included when enough companies are available that a reliable comparative analysis can be performed. The available sectors are:
Comparing and analysing the performance of cryptocurrencies
The most traded and popular cryptocurrencies a comparison page is available using the same performance and technical features as for the stocks. Each of the individual cryptocurrency also has a technical analysis similar to the identical stock. The combination of the comparison page and the individual analysis make it a solid cryptocurrency analysis platform.
A range of technical indicators are available to analyze shares
Across the different individual stock analysis a set of performance and technical indicators are available that are derived from price and volume. Together these make up a profile of an individual share. A carefull selection has been made to avoid duplication of indicators that only differ moderately. The available technical indicators (with a link to their description) are:
Tip 6: Identify the most traded companies
Every stock market index or sector has its favourites for buying and selling. Each comparison page includes a histogram that shows the traded value, which is the combination of the volume (number of shares) and the close price. When plotted in a histogram they sorted according to their size, hence the ones that have the most money being traded is located on the left. For each index (or sector) this makes it straightforward to identify the most traded stocks in terms of monetary value.
All tips & tricks have been collected in a dedicated page. Spend a few minutes there to make the most out of the Stock Comparison Tool.
Updates December 2025
• The CAC is updated. Bureau Veritas and Euronext are added while Teleperformance and Vivendi have been removed. Arcelor Mittal is now completing the CAC index.
• The article on MACD received an update to clarify the content better, improve readability and add references.
Updates October 2025
• The SMI had a change of Sonovo Holding being removed while Amrize was added. This has been updated and the whole page SMI received some small updates.
• Next index that received an update is the DAX. Removed are Dr. Ing. Porsche, Sartorius and Covestro. These have been replaced by GEA Group, Scout24 and Fresenius Medical Care. As a minor change, HeidelbergCement has been renamed Heidelberg Materials.
• The RSI article received a number of updated and now provides very good descriptions and insights into the relative strength index.
Updates September 2025
• The article on the Commodity Channel Index (CCI) and the Stochastic Oscillator have received several updates.
Updates August 2025
• The article on Money Flow Index (MFI) has been updated.
• The article describing On-Balance-Volume has also received an update.