Author: Berry Matijssen
Reading time: 4m:22s
Updated: 17 June 2023
Index
1. How much does it cost to produce a car
2. Amount of cars sold by each manufacturer
3. The cost of goods sold (COGS) for each vehicle
4. R&D expenditure
5. What remains as a net profit margin
6. Conclusion
1. How much does it cost to produce a car
In the popular podcast ‘Behind the Glass’ the two presenters ‘Sam from the Youtube channel Seen though glass’ and ‘Tony from Gravelwood car sales’ were wondering how much it costs to produce a car. More specifically, which percentage of the sales price is actually spent on building the car. This is not easy to find out as the actual numbers are difficult to obtain. Luckily there are several car companies listed on the stock market that every year publish an annual report that provides some insight into this mystery.
The main numbers that are used to write this article are the cost of goods sold (COGS) which represents all costs (material, labour and other related to manufacturing) of cars that are sold, revenue and net profit. All of these numbers need to be taken with a grain of salt as they are obtained from different sources and different ways of accounting (GAAPS or IFRS) could have been applied.
One important thing to note is that the costs are relative to the revenue for the company. This means that value added tax (VAT) is excluded as it is not part of the revenue. This is quite significant as this can easily be 20% on top of the price and variers for each country. This also means the main organisation that takes profit from car sales is the government.
Another issue is that not all revenue comes from the sale of cars. Some manufacturers also make motorcycles which have a lower price, provide infrastructure or services and merchandise also plays a role. A similar case is for buying parts from other companies. This means that a car producer does not have to spend money on R&D. To keep it simple for now, all revenue, COGS and R&D expenditure is assigned to cars.
Going through the results of Tesla I also dived in its annual report. Apparently, there has been some schoolboy fun going on as Elon Musk has named himself technoking and Zach Kirkhorn is now a.k.a. Master of Coin. Despite these flamboyant names they still need to add the looks of TechnoViking and some funky dance moves before they will reach the ultimate level of coolness.
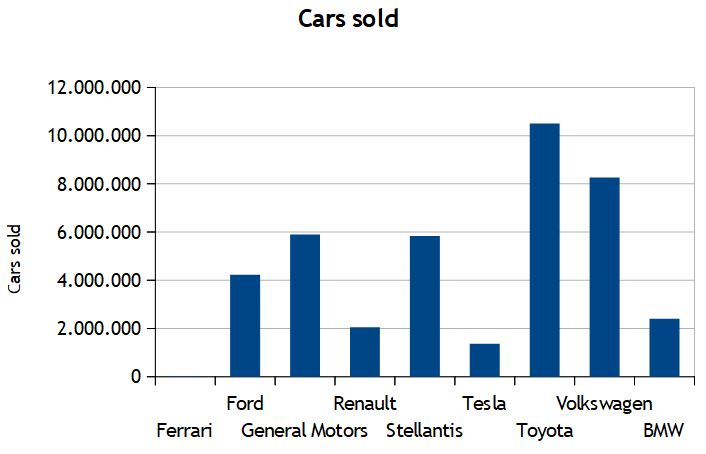
2. Amount of cars sold by each manufacturer
To get a view of the size of these manufacturers the amount of cars they produce each year is plotted in a graph. The largest ones are Toyota and Volkswagen followed by Ford, General Motors and Stellantis. The others (Renault, Tesla and BMW) are much smaller. A tiny car manufacturer is Ferrari with only 13.221 car sold in 2022. Despite supercars being visible everywhere these days on social media such as Instagram and make a regular performance at car shows, the fact that they don’t even show up in a histogram clearly shows how rare and unique these cars are.
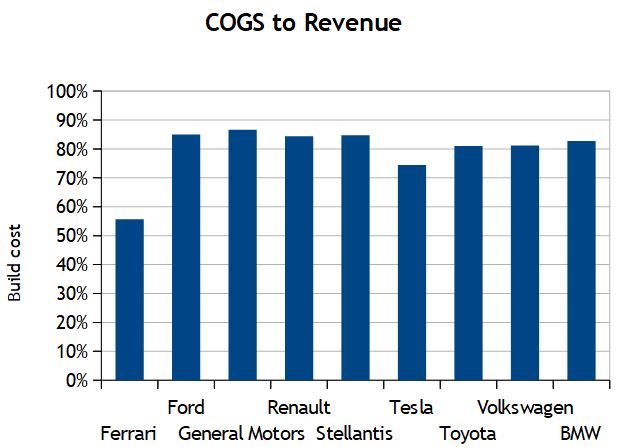
3. The cost of goods sold (COGS) for each vehicle
The main question, how much of the sales price is a car can be answered by comparing the cost of goods sold (COGS) to the revenue. In general, the graph below shows that 80-85% of the revenue is production cost. This is a significant cost and given the efficiency of production (automation, robotization etc.) this indicates how difficult it is to build a high-quality car at the price that it is currently sold for. This can be converted to the sales price of a car. With these rates and using a VAT of 20%, a car that costs 40 thousand to buy would have cost 27.5 thousand to manufacture.
There are two exceptions which should be discussed. Tesla has a much lower ratio of COGS to revenue, making it a very efficient manufacturer. There could be an explanation for this. In the media there is a significant amount of reporting that goes into the build quality of Tesla models. This is not necessarily that the quality is lower, but more that certain traditional features are left out and digital features are introduced, hence reducing the production cost. It requires more research to make claims about this.
Most noticeable is Ferrari for which around 55% of the revenue is the build cost. It is possible to work out that a Ferrari costs 214.500 Euro to manufacture which is a large amount. A possible explanation could be the difficulty in automating or robotizing low quantity manufacturing resulting in a high labour cost per car. Using the 55% ratio and a VAT of 20%, this means that an average sales price of a Ferrari is 467.000 Euro.
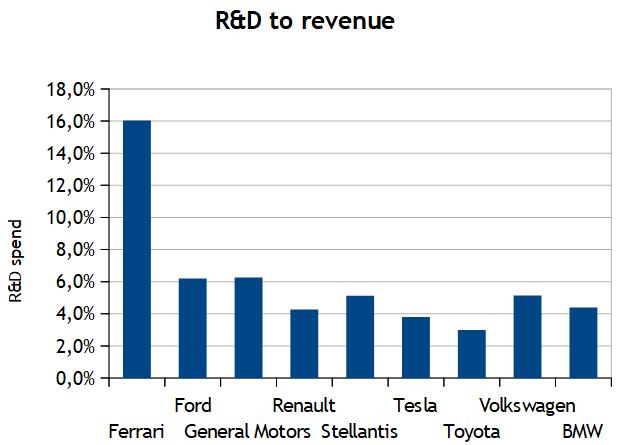
4. R&D expenditure
The R&D spend compared to revenue show a considerable variation. This ranges from 3% from Toyota to 6.3% of General Motors. Therefore, there is not really a reference point to how much a car manufacturer must invest in R&D. Surprisingly, large manufacturers like Ford, General Motors and Volkswagen make large investments while given their size it could be expected that they can re-use their technology across different models, requiring lower investments. This could explain the low R&D costs for Toyota. Surprisingly, Tesla is on the lower end which could reveal it is not as much of a technology company as it portrays to be.
The main exception is Ferrari which spends 16% of their revenue on R&D. This highlights the investments that are needed to build luxury high performance sports cars, but also that they are much more a technology company than a traditional car manufacturer. This also indicates the sizeable barrier there is to launch a successful high-performance car with several brands not being able to make a profit (Spyker, Fisker, Apollo) or sell at a loss (Bugatti Veyron, Lexus LFA).
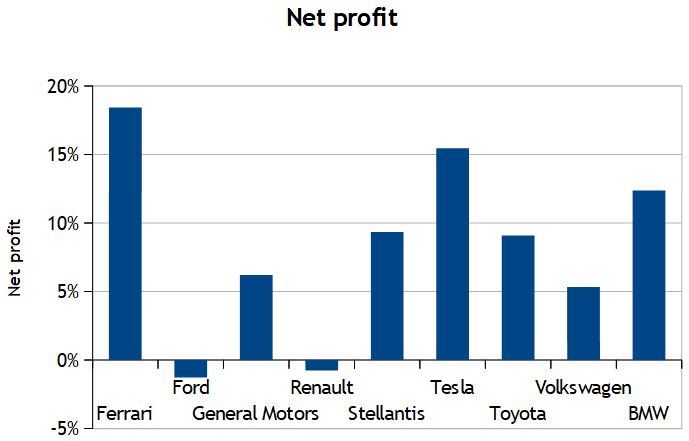
5. What remains as a net profit margin
The most important end result is the net profit as this is the money that remains at the end. These numbers vary considerably for each brand, and this underscores the difficulty to successfully run a car brand. It could be noticed that the premium brand such as Ferrari, Tesla and BMW are more profitable than the other brands. This is not completely true as Toyota and Stellantis make a decent margin but produce many (more) cars. Still, the results of Renault and Ford show that it is not that easy. A trend that has recently been going on is that small cars are disappearing from the market as they are not profitable. That view is (sort of) confirmed by these numbers. Undoubtedly, a focus on premium cars that bring in profitability will remain.
6. Conclusion
One thing is for sure, the automobile industry does not create a high margin for all players and premium manufactures appear to do better. The R&D investments vary considerably and are not linked to profit or company size. This means that it is not easy to create a successful automobile company. And to get back to the question of Sam and Tony, it does really cost the price of a house to manufacture an exclusive supercar!
Are you interested in investing in automotive companies that are listed on the stock market. StoCoTO has a useful page that helps you with comparing and analyzing the stock performance of these companies. Follow this link and get inspired and informed. For a deep-dive into technical analysis check out Tesla.