A lagging indicator that measures historical share price fluctuation over time
Author: Berry Matijssen
Reading time: 4m:18s
Updated: 6 December 2024
Content
- Volatility in a nutshell
- Key points
- Calculation and formula
- Insights provided by volatility
- Limitations
- Practical example
- Comparison to other indicators
- Using volatility on stocoto.com
- A word of caution
- Other relevant articles on StoCoTo
1. Volatility in a nutshell
Volatility is a statistical measure of the variation in price over a defined time-period for a single share. In general, the assumption is made that an increase in volatility is associated with an increased risk of price fluctuation of a stock. Volatility is calculated using the standard deviation or the variance of the price change of a share.
Volatility is usually referred to as the amount of uncertainty or risk related to changes in the share price. A higher level of volatility indicates that the price value of the stock can potentially be spread out over a larger range of values. This means that the price of the share can change considerably over a short period of time in the near future. The direction is not defined, as it can move higher or lower. A low level of volatility indicates that a share price has not fluctuated much in the recent (selected) time period, and the assumption that is often made is that it will be more stable over time. It should be noted that this is based on historical data and is not guaranteed for the near future, as most share prices move over time and go through periods of high and low volatility due to market circumstances.
There are two types of volatility: historical (realized) and implied (expected). Historical volatility is based on historical prices of a defined timeframe and presents the variability in the price change of a share. This value is expressed as a percentage. Implied volatility is the expected movement of the share price in the future. It is not the same as historical volatility and because it represents future market expectations, it is significantly more uncertain. Historical volatility is a lagging indicator as it describes past behaviour. This implies that it has no real value as a trading indicator. However, to an investor, it provides an indicator of the risk associated with its portfolio in the short-term.
2. Key points
- Volatility represents how much the price of a share has moved around its mean price for a defined period of time. It is a statistical measure of its recent fluctuation.
- Volatility is the standard deviation over a reference time (week, month, quarter, year).
- There are two types of volatility: historical (realized) and implied (expected).
- Stocks with a high volatility are often considered riskier because the price is expected to be less stable and, therefore, less predictable.
- Volatility measures the fluctuation of a share price, not its direction. A higher level of volatility can result in a future price that moves higher or lower.
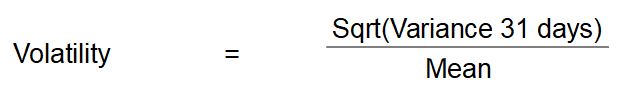
3. Volatility calculation and formula
Volatility is calculated using variance and standard deviation (the standard deviation is the square root of the variance). Because volatility describes changes over a defined period of time, a number of days must be selected, and this choice will influence the relevance of the calculated number. There are two timeframes that are chosen: 31 days, which represents 1 month and 92 days representing 3 months.
The volatility of a share is calculated using the following steps:
- Calculate the mean and variance of the price over a selected period (31 or 92 days).
- Determine the square root of the variance.
- Calculate the difference between each value and the mean.
- Determine the variance by taking the sum of all these numbers and dividing it by the number of datapoints.
- Divide this square root of the variance by the mean. The resulting number is the volatility. (see formula Volatility)
Updating and interpreting volatility needs to be taken into consideration. Volatility is calculated at the end of the day. Calculating this more often to obtain a real-time insight has limited value. Because it is measured over a 31-day period (or more), it is unlikely to change significantly within one trading day.
4. Insights provided by volatility
Volatility cannot be interpreted directly, as many factors can be responsible for this value. Modern portfolio theory describes that a larger standard deviation indicates a higher spread of return that is coupled with an increased investment risk. This indicates that the fluctuations of a stock price are larger, but the direction in which the price moves is not yet determined and can be up or down.
Volatility can be used to determine the risk of a portfolio. If it contains many shares with high volatility, then the value of the whole portfolio can change significantly in a relative short time. This does not mean all shares move in the same direction at the same rate. To counter risk, it is possible to weight the portfolio with less volatile shares and ones that are expected to move more, to align the stock mix with the desired risk profile.
If a portfolio is to be expanded, volatility can provide guidance in determining the size of that share in the portfolio. If a new share takes up a large proportion, this could increase the risk of the whole portfolio significantly. In addition, a specific share could be taken out of the portfolio, resulting in reduced volatility for the portfolio as a whole.
For speculative purposes, volatility creates an opportunity to buy or sell shares that are perceived to be under- or overvalued. Often, there are underlying reasons for this occurrence, and a high volatility with a relative low price does not automatically mean it will move up again. It is more sensible to do research and reading up on a stock to understand the driver of this price change and included that information in any trading decision. In this way, companies can be selected for further investigation as potential investments.
When a share price bottoms, volatility is likely to decrease as a new stable price-point has been realized. The opposite can possibly be seen when a share price reaches a peak and there is an increased possibility that trading by nervous or indecisive traders can influence the price. When a market sees a lot of turmoil, then large volatility is often observed in response to a high sell-off. It should be noted that volatility is often the result of buyers and sellers behaviour in the current moment.
5. Limitations
The main limitation of volatility is that it reports recent price changes. Therefore, it is used as an indicator for risk for the shares of a company. However, past behaviour does not correlate directly with future behaviour. If this effect occurred, the future price trend of an individual stock would be straightforward to predict. In practice, this does not work and has using it in this way has resulted in many failures. Especially a long-term assessment of the stock is challenging as there is little correlation to recent price changes.
It is possible to generate a volatility indicator for a full index or sector. However, due to the diversity of companies that make up the total and their different weightings, the value of the volatility is low to investors. For a single share, it is more important, and it is possible to take action. The individual shares that make up a portfolio should, therefore, be assessed individually to determine its impact.
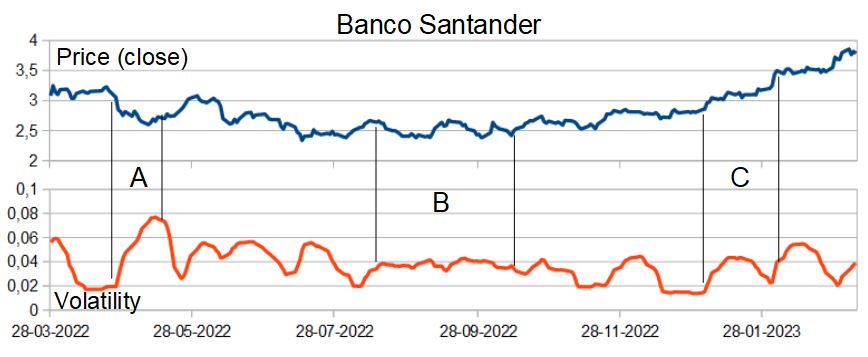
6. Practical example
An example of the 1-month (or 31 days) historical volatility in practice can be seen using the share price of Banco Santander. Within the selected timeframe, the closing price and volatility are plotted next to each other. In this example, three distinctive events are selected.
A) the share price goes down
B) the share price fluctuates
C) The share price increases
In the first situation (A) in which the share price goes down, a clear increase in volatility is observed and keeps increasing until the price hits a stable level and drops sharply. It should be noted that the volatility peak is much higher than elsewhere in the graph.
The second situation (B) shows a period in which the share price moves up and down and volatility remains stable. When comparing this part to the rest of the graph, the volatility hovers around 0.04 giving it a fair assessment of its fluctuation and its level is at the average compared to the full-time period.
The third situation (C) shows an increase in price over a certain period, but with a stable period in between. The price increase corresponds to an increase in volatility but flattens and decreases when a new price constant has been reached. As soon as the price increases again, the volatility increases as well.
7. Comparison to other indicators
Volatility is a purely lagging indicator with no direct predictive value, as it reports the level of price change and is not intended to be an indicator of price change. This is in contrast to other technical indicators such as MFI, OBV and CCI which attempt to provide a signal that indicates buying or selling.
However, it does provide an understanding of the changeability of share price. It is non-directional as the stock can increase, decrease or consist of a combination of both. The other indicators do not indicate this feature, making it different in what it is attempting to achieve. As such, it is an indication of the current state of share price behaviour.
8. Using volatility on stocoto.com
The StoCoTo platform makes use of volatility in the stock comparison of a selection of indexes and sectors, but also on the individual stock pages. For the comparison pages, it is a powerful parameter to see which companies have seen their price move the most. Combine this with volume and the price direction, and useful insights can be obtained.
In the technical stock analysis of individual pages, volatility is plotted against the share price over a minimal time period of one year. Because it is price dependent, there is no reference. The only thing it could be compared to, is that if the stock does not move at all a volatility of zero occurs, but this never happens. It is a useful parameter to establish if price volatility is still high or that a return to a ‘normal’ level has occurred. It should be remembered that volatility is a lagging indicator and has no predictive value. To establish a technical trading indication, it is possible for the trader to check the behaviour of other technical indicators around the same time point in a fast manner, as the different graphs cover the same timeframe.
9. A word of caution
Technical indicators have been around for many years, and this prolonged existence makes them a good cause for using them. It should be noted that volatility is a historical parameter and does not predict the future, nor is it intended to do so. Furthermore, volatility measures fluctuation and does not indicate the direction in which a stock moves. Therefore, relying on one indicator is not good practice and a better approach would be to combine this feature with other sources of information to analyse a stock and assess its associated risks. In addition, developing a trading strategy that includes other technical indicators and reviewing the performance and learnings of this strategy is more likely to lead to good results than relying only on a single indicator.
10. Other relevant articles on StoCoTo
Read more about volatility in the Big Manual
Other cumulative indicators are: A/D Indicator and OBV
Other technical indicators based only on price are: CCI, MACD, RSI and Stochastic Oscillator
#volatility #variance #technicalanalysis #technicalindicators #tradingsignals #risk #portfolio #laggingindicator