A leading technical indicator for speed and magnitude of momentum based on share price
Author: Berry Matijssen
Reading time: 4m58s
Updated: 10 October 2025
Content
1. Introduction: The Relative Strength Index in a nutshell
2. Key points about the Relative Strength Index that are essential to know
3. RSI calculation, formula and considerations
4. Trading insights provided by the relative strength index
5. Limitations in practical use
6. Practical example of buying and selling opportunity based on NVIDIA stock
7. Difference between the technical indicators RSI and MACD
8. Using RSI graphs on the stock comparison tool StoCoto
9. A word of caution about using technical indicators such as RSI
10. References and relevant articles on StoCoTo
1. Introduction: The Relative Strength Index in a nutshell
The relative strength index (RSI) is a momentum indicator based on price. RSI is intended to measure the strength and weakness of the market and calculates the speed and magnitude of recent price changes of a stock. It is one of the most popular technical indicators used by traders to evaluate if a share is overvalued or undervalued, which could be a signal to buy or sell a share. The RSI has a range between zero and 100. If plotted over time, it has the shape of an (irregular) oscillator. It is intended to precede a price move and, therefore, considered a leading indicator. In contrast, because it is dependent on price only, which needs to move first, it can also be considered a lagging indicator.
The RSI can be used by investors as an indication to buy or sell. In general, an RSI reading of 70 or above is believed to be an overbought situation. In contrast, a reading of 30 or below suggests an oversold condition. Signals of above 80 or below 20 are considered stronger, but occur less frequent, hence missing trading opportunities. In addition to the signal of overbought and oversold, it can also indicate if a share may have a trend reversal or corrective pullback in price.
2. Key points about the Relative Strength Index that are essential to know
- The relative strength index (RSI) is an indicator of momentum and provides signals about bullish and bearish price levels.
- It calculates speed and magnitude of share price changes in the last 10 trading days.
- The RSI is based on price, not on volume. Therefore, it cannot be considered a truly leading indicator. However, it is intended to determine oversold or overbought price points, giving it leading properties.
- The shape of the RSI is an oscillator that moves between 0 and 100.
- As a reference, a share is considered overbought when the RSI is above 70 and oversold when it is below 30.
- Trading signals are considered stronger when they are above 80 or below 20, but these are less likely to occur.
- Divergence can occur, in which price and RSI do not move in the same direction. Potentially, these are stronger trading signals of a trend in which the price will continue its path.
3. RSI calculation, formula and considerations
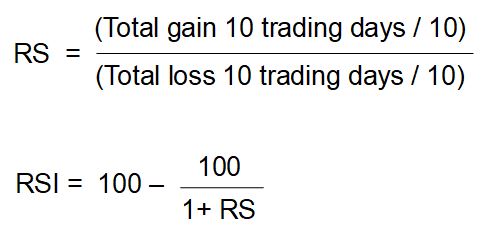
The RSI uses only price information of a stock. The standard trading time is 10 trading days or 14 days of the year. The RSI makes use of two calculations. The first step to calculate the Relative Strength (RS) and the second step to covert it into a value which is bordered between 0 and 100. The final outcome is referred to as the Relative Strength Index (RSI).
The steps to calculate the RSI are:
- For the historical period (10 trading days or 14 days), the positive and negative returns are determined.
- Using these two sets of values the average gain and average loss are calculated.
- These two averages are combined by dividing them (see formula Relative Strength (RS) ). This is achieved by dividing the average gain by the average loss.
- Turning this ratio into an index between 0 and 100 an indexing calculation is applied (see formula Relative Strength Index).
The RSI is based on two weeks of trading. This can be represented by taking 14 days of the year or using 10 trading days. Both will on some days give a different number if, for example, the stock market was closed on a day. They are not expected to be far apart from each other and it is difficult to indicate which choice of 10 trading-days or 14 days performs better overall.
There are alternative ways of calculating the RSI. Wilder created the original function. Modifications can be made using an exponential moving average. Another version has been made by Cutler which does not depend on the length of the dataset. Also, a different interpretation has been created by Cardwell. All of these provide a different number with a different interpretation, but are based on a similar principle. Most likely, all of these will perform better is some situations, but it is difficult to identify up front which one is better.
4. Trading insights provided by the Relative Strength Index
The RSI can be used as a single value in an XY-chart to compare different listed companies to each other. In this case, only a single value is available in the analysis. Alternatively, the RSI can be plotted over time in a line-chart to understand its relation to price change, its trading performance and observe (current) trends. Both can be used in a strategy to first indicate potential opportunities and then perform a deep-dive into a selected share.
Overbought refers to a price level that needs to be paid above its intrinsic value, usually based on fundamental analysis. If there are indications that a stock is overbought, a trader might expect a price correction or trend reversal and sell it. A similar principle applies to a share that technical indicators such as the RSI indicate as oversold. It can be viewed as trading at a lower price than the fundamentals of the company indicate. A trader could observe such an indication and expect a trend reversal resulting in a price increase and buy the share.
An indication by the RSI for a share being oversold in an uptrend is when it reaches above 70, while an indication for overbought during a downtrend occurs when it crosses a value of 30. This is often referred to as a value of below 30 being a bullish and a value over 70 being bearish. These values highlight a possibility for a trend reversal or a corrective pullback of the share price. Higher and lower levels such as 80 and 20 occur less frequent, but act as stronger indicator of overbought or oversold. Using these stronger values only would result in more trading signals being missed as an opportunity.
Apart from the threshold, a divergence could provide a stronger indication of the overbought/oversold signal. An RSI divergence occurs when the price moves in the opposite direction of the RSI. This can go in both ways (up or down). A bullish divergence is seen when the RSI drops below 30 (indicating oversold) followed by the price lowering further. This could indicate a rise in the bullish momentum and lead to the price lowering further. In contrast, a bearish divergence occurs when the RSI is above 70 (indicating overbought) but the price continues to increase.
Additional price-RSI relationships consist of positive and negative RSI reversals. A positive RSI reversal could take place when the RSI reaches a low that is below its previous low, but at the same time the price of the share a low that is higher than its previous low. This could be considered a bullish sign and act as a buy signal.
In contrast, a negative RSI reversal may take place when the RSI reaches a high that is higher than its previous high and at the same time that the share price reaches a lower high. This combination could be considered a bearish sign and act as a sell signal.
5. Limitations in practical use
As RSI is an oscillator based only on price, the common limitations of false, missed and lagging trading signals apply. The false trading signal is most common with the RSI indicating a stock is overbought or oversold but the current trend continues.
The missed trading signal sees a new price trend occurring, while the RSI did not indicate a change in trend. Other factors than share price behaviour such as sudden company announcements regarding profit warning or unexpected growth could be responsible for this.
A lagged signal occurs when a trend first happens, and then the RSI follows. For example, a price could increase, and then a signal is given to buy. Depending on the length of the trend the opportunity could have been missed as it is unknown at the start of a new trend how long it could last.
The RSI is designed to provide a trade signal that a reversal of the price direction is about to happen. It does not indicate how long this new trend will occur. Therefore, the trader must think about the time-frame to act on these signals.
6. Practical example of buying and selling opportunity based on NVIDIA stock
An example for the RSI in practice can be obtained by looking at its relationship to price for NVIDIA. In a period of one year, it crosses the threshold of 30 and 70 several times. Four of these crossings are examined and provide an insight to the ability of RSI to predict a price change and also where it produced a false signal.
These four situations are:
A) It comes close to the 70-threshold and subsequently there is a lowering in price.
B) The threshold of 70 is crossed and thereafter the price fluctuates and drops.
C) The price reaches below 30 and after it lowest there is a significant price increase for a prolonged time.
D) The RSI goes above the threshold of 70, but the price continues to increase and the RSI drops.
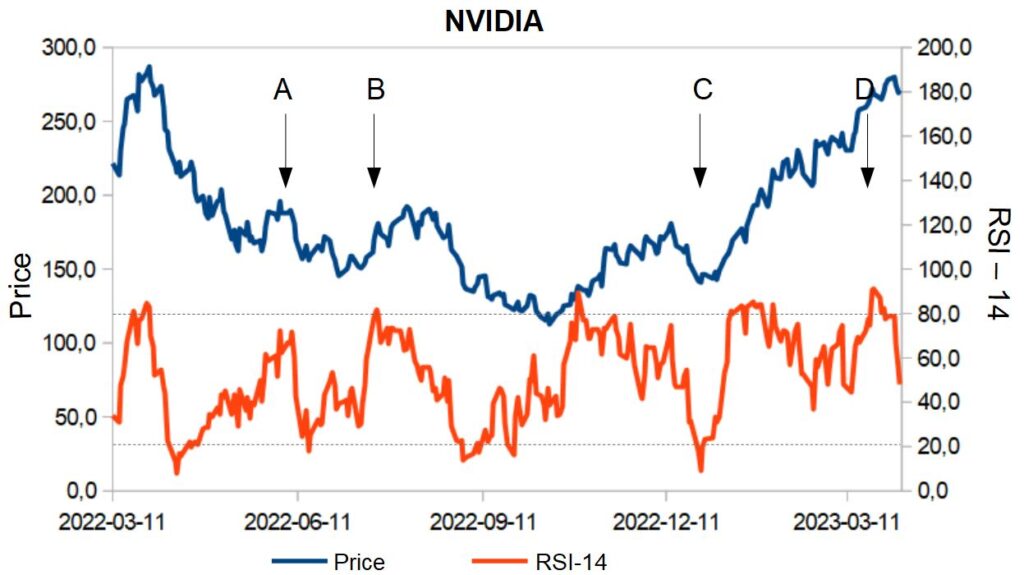
Inspecting the graph in more detail, this example shows that the RSI has a significant likelihood of producing false signals. However, in several cases it is spot on. Instead of using the thresholds as a hard cut-off for buying or selling, they can be used to assess the performance of the stock with other indicators to determine its risk and future direction. When the RSI fluctuates within the threshold, it is likely that the current trend (being up or down) will continue.
7. Difference between the technical indicators RSI and the MACD
The moving average convergence divergence (MACD) is another trend-following momentum indicator that shows the relationship between two moving averages of the price of a share. Both RSI and MACD are based on price over time and ignore volume.
The MACD calculates two numbers: a MACD value and a signal value. If the MACD move above the signal line, it suggests a buy. In reverse, if the MACD goes below the signal line it could indicate a sell. The MACD calculates two values based on price and compares these, while the RSI calculates only one value.
The MACD measures the relationship between two exponential moving averages (EMAs), while the RSI measures price change momentum in relation to recent price highs and lows. These two indicators can be used together to provide a more complete technical view of recent stock price changes.
Both indicators measure the price momentum of a stock. However, because they are made up of different factors, the result can be two indications that are contradicting. For example, an RSI can be over 70 indicating it is overbought while an MACD above the signal line could indicate it is underbought and in practice the price could increase. The reverse or other combinations could happen as well. This highlights the use of multiple technical indicators to have more information about current stock market price levels. If different signals are obtained, a discussion should be started to understand these differences and make better informed decisions about the future price movement.
8. Using RSI graphs on the stock comparison tool StoCoTo
The StoCoTo platform makes use of RSI in multiple ways. This is based on the principle of finding an opportunity first, followed up by a deep-dive. First (finding the opportunity in the market) are the analysis pages in which stocks in market indexes or sectors are compared. A chart is available in the trading opportunity section, where it is compared to MFI. For both indicators, a reference line is available. These two technical indicators are commonly used as signals for buying and selling. One advantage of multiple stocks in one graph is the comparison to other companies.
The second application (deep-dive) is the individual company stock pages, in which the RSI is plotted against the share price over a minimal time period of one year. This allows the trader to observe historical price changes in relation to the trade signals provided by RSI. Using the other charts, it is also possible to compare the behaviour of other technical indicators around the same time point of a price change occurring.
9. A word of caution about using technical indicators such as RSI
Technical indicators have been around for many years, and this prolonged existence makes a good cause for using them. It should be noted that the RSI can produce a false signal. Crossing a threshold can indicate a change in price trend, but moving the RSI back from the threshold can indicate a continuous price trend. This can only be established at a later time point. Therefore, relying on one indicator is not good practice and a better approach could be to combine them with other sources of information to analyse a stock and assess risks. In addition, developing a trading strategy that includes technical indicators and reviewing the performance of a company and regularly evaluating this strategy is more likely to lead to good results than relying only on a single indicator.
10. References and relevant articles on StoCoTo
Wikipedia – Relative strength index
Investopedia – What it is, how it works, and formula
Investopedia – RSI Indicator: Buy and Sell Signals
Trading view – Relative Strength Index (RSI)
Read more about the RSI in The Big Manual
Other oscillating indicators are: CCI, MACD, MFI and Stochastic Oscillator
Other technical indicators based only on price are: CCI, MACD, Stochastic Oscillator and volatility