A leading indicator linking daily price behaviour and volume to share price movement by determining if a stock is accumulated or distributed
Author: Berry Matijssen
Reading time: 4m:58s
Updated: 23 August 2024
Content
- The A/D indicator in a nutshell
- Key points
- A/D indicator calculation and formula
- Insights provided by the Accumulation/Distribution indicator
- Limitations
- Practical example
- Difference between the A/D indicator and On Balance Volume
- Using the A/D-indicator on stocoto.com
- A word of caution
- Other relevant articles on StoCoTo
1. The A/D indicator in a nutshell
The accumulation/distribution indicator (A/D) uses volume and price changes within a trading day to determine if a stock is being accumulated or distributed. The trend over several days is summed up in the A/D indicator. Accumulation refers to buying, while distribution refers to selling. The A/D indicator attempts to determine if the money flow is in line with its associated price change. When the A/D and price both increase (or both decrease) they are aligned, and the trend is indicated to continue. However, when a divergence occurs between both lines, the trend has the potential to change and depending on the direction of price could change, providing a bearish (sell) or bullish (buy) signal. The A/D indicator is calculated using volume. Combined with its intended purpose to predict potential price reversals, it is considered a leading indicator.
2. Key points
- The accumulation/distribution (A/D) line measures accumulation (buying) and distribution (selling) based on the daily price behaviour multiplied by volume (money flow).
- The A/D indicator is cumulative as the current one flow is added to the previous one. Therefore, it has no reference value and the trend compared to the price determines the signal.
- In general, a rising A/D line confirms a rising price trend, while a decreasing A/D line confirms the downtrend of a price. If a divergence occurs between the trend of the A/D line and the price, then the potential for a price trend reversal is significant.
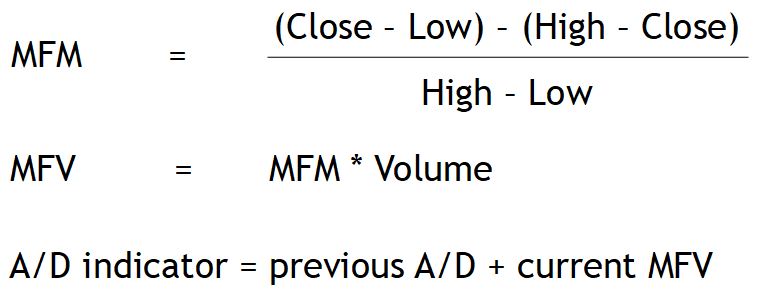
3. A/D indicator calculation and formula
The calculation of the A/D indicator involves three steps. First, the multiplier is calculated, secondly the money flow and thirdly the indicator. The multiplier determines the fraction of the volume that is being used in calculating the indicator. Volume is reduced by the multiplier, unless the values are located at the extreme end (+1 or -1). It also determines if volume is added (positive contribution) or subtracted (negative contribution). The money flow combines the multiplier with the volume. Adding up all the money flows provides the A/D indicator that can be used in the chart to compare to share price.
In a more organized way, the calculation of the A/D indicator can be described in four steps:
- Calculate the Money Flow Multiplier (MFM) using the close, low and high of the trading day (see formula).
- Obtain the Money Flow Volume (MFM) by multiplying the MFM with the price of the same trading day (see formula).
- The first A/D indicator is the first MFM of the series.
- The A/D of each trading day is obtained by taking the previous A/D and adding the MFV of the current trading day.
4. Insights provided by the Accumulation/Distribution indicator
The A/D line helps to show how supply and demand factors are influencing price. In a line chart, the A/D values can be plotted against the share price over time to compare trends in the movements of both lines. The A/D indicator can move in the same direction as price changes (and in proximity) or in the opposite direction, which is referred to as divergence.
The multiplier in the calculation provides a correction for the strength of buying or selling during a particular period. This is determined by establishing if the closing price was positioned in the upper or lower part of the trading range of the day. This correction factor is then multiplied by the volume of the same trading day. When a stock closes near the high of the day range and has high volume, the result will be a high money flow and result in a strong increase in A/D. This also means that if the price finishes in the middle of the trading range and has a similar volume, the increase in A/D-indicator will be moderately. Similar, if the multiplier is high, but volume is low, than the increase in A/D will be moderately.
The same concept applies when the price is in the lower half of the daily price range, although the multiplier will be negative. As a consequence, the daily money flow will be negative, and the new A/D will be reduced.
The A/D line is used to understand price trends in the current market and potentially identify upcoming reversals. If the price of a stock is in a downtrend while the A/D line is in a uptrend, the indicator suggests there is pressure to buy (accumulation). This could result in a price reversal, and it starts to rise again. In contrast, if the price of a share is in a uptrend and the A/D line is in an downtrend, the indicator signals pressure to sell (distribution). This can be used as a warning signal that the price may reverse and decline. These insights into up- or downtrend make the A/D-indicator a valuable tool as part of data driven decisions within a trade strategy.
In both cases (price increase or decrease), the steepness of the A/D line provides an additional insight in the trend. A strongly rising A/D line confirms a strongly rising price as the desire to buy the share is still there, Similarly, if the price is falling and the A/D-indicator is also falling, this suggests growing distribution (pressure to sell) and the share prices is likely to decline further.
If the price is rising for a significant time and the A/D line is rising at a similar pace, this could mean that a breakthrough could occur, and prices could continue to rise through the ceiling. The same principle occurs when prices are falling and going through the price-floor, a continuation of this trend could occur.
5. Limitations
The A/D indicator does not factor in price changes from one trading day to the next one and focuses only on price fluctuations within the current day. This can create strange behaviour. For example, if a price declines significantly compared to the day before but ends up in the upper half of the daily range, it is calculated with a positive multiplier and contributing positively to the A/D despite the share losing value.
One of the uses of the A/D indicator is to monitor for divergences. This happens when the A/D line and price trend move in opposite direction. This can act as a signal for a price reversal. It should be noted that divergences take time before they are visible and can last a long time. This makes it difficult to recognize them, and it is no known when the reversal will take place or will happen at all. The reason that divergences exist is that the technical indicator does not operate directly on price but is intended to highlight potential for a future change.
When a divergence occurs, the A/D-line and the price trend need to align again. This takes time, and during this time it is challenging to determine if they are aligned. Until they follow the same trend, it is difficult to establish new convergences. Therefore, understanding the stock market is not always possible with the A/D indicator and focusing on correct timing is essential.
6. Practical example
An example of this indicator in practice can be seen when comparing the A/D line and price for Akzo Nobel. In general, the two lines align, but there are a few points where they differ. At point A the A/D line increases while the price remains flat. Shortly afterwards, the price jumps significantly, indicating that the A/D signal gave the correct indication. Similarly, at point B, the A/D line keeps increasing (although moderately) while price remains flat. Then the price increases indicating that the A/D was again predictive. It should be noted that afterwards the A/D line and the price line follow the same trend, indicating they are in balance again.
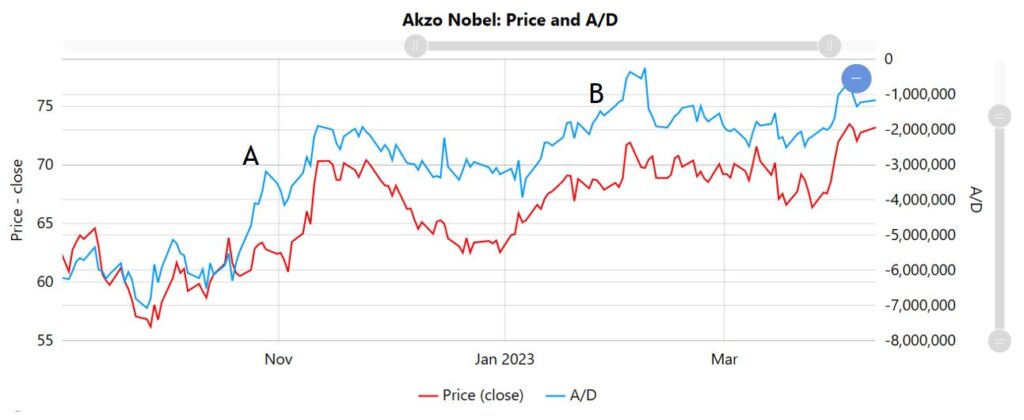
The A/D indicator is difficult to interpret. The example shows that the two lines do not fully overlap. This can be explained as the divergence between A/D line and the price line results in a shift of the position. Because of this shift, it could appear that both lines differ, but if a different scale or starting point was chosen they would show good overlap.
A second difficulty is that convergences can happen shortly before price changes. This could mean that by the time the A/D signal indicates clearly a signal of overbought or oversold the price has already started to change and, thereby, the signal and opportunity to buy or sell has been lost. Therefore, traders have limited time to make a decision, making the time-frame in which the A/D-indicator provides a useful signal relatively short.
7. Difference between A/D indicator and On Balance Volume
Both the A/D indicator and On Balance Volume (OBV) use price as a guide and volume to determine the value. The difference between both is that OBV looks at the price change compared to the previous trading day, while the A/D-indicator uses price changes within the current trading day. On Balance volume (OBV) looks at whether the current closing price is higher or lower than the prior close. If the close is higher, then the period’s volume is added. If the close is lower, then the period’s volume is subtracted.
The A/D indicator doesn’t factor in the close of the previous trading day and uses a multiplier based on price changes and closing within the current trading day. This difference in price reference makes the calculations different and, therefore, provide a different indication.
8. Using A/D-indicator on stocoto.com
The StoCoTo platform makes use of the A/D-indicator in the deep-dive pages of the individual stocks. In the line chart, it is compared to the share price over time, making it possible to directly compare both trends and establish if they follow each other or that a divergence occurs. The historical values and trends also allow the trader the effect that previous trading signals had by checking if they resulted in a price shift. In addition, the use of other graphs on the same page makes it straightforward to observe if other indicators (such as RSI or MFI) also provide additional trading signals or insights.
9. A word of caution
Technical indicators have been around for many years, and this prolonged existence makes a plausible cause for using them in a stock trading strategy. But it should be noted that the A/D indicator is a historical parameter and does not predict the future, but it intended to provide a signal that can be further investigated and its value assessed. Furthermore, the A/D indicators calculates trading activity and does not directly indicate the direction in which the price of a stock moves. Therefore, relying on one indicator is not good practice and a better approach could be to combine it with other sources of information, such as news and company performance reports, to analyse a stock and assess its associated risks. In addition, developing a trading strategy that includes additional technical indicators and reviewing the performance and learnings of this strategy is more likely to lead to good trading results than relying only on a single indicator.
10. Other relevant articles on StoCoTo
Read more about the A/D Indicator in The Big Manual
Other cumulative indicators are: Volatility and OBV
Other technical indicators that combine price and volume are: MFI
#accumulationdistribution #adindicator #tradingvolume #moneyflow #technicalanalysis #technicalindicators #tradingsignals #stockmarket #traders