A leading indicator linking share price behaviour to share price movement
Author: Berry Matijssen
Reading time: 5m:17s
Updated: 5 July 2024
Content
- The CCI indicator in a nutshell
- Key points
- CCI calculation and formula
- Insights provided by the CCI indicator
- Limitations
- Practical example
- The difference between the CCI indicator and Stochastic Oscillator
- CCI on StoCoTo
- A word of caution
- Other relevant articles on StoCoTo
1. The CCI indicator in a nutshell
The Commodity Channel Index (CCI) is a technical indicator that represents momentum and is intended to determine if a stock is overbought or oversold. It evaluates the direction and strength of the price trend. When the pattern changes, it suggests a trade signal. The visualization has the shape of an oscillator but is not bound by limits. This makes its interpretation more challenging, as no direct reference values are available. To compensate for this, in the formula to calculate the CCI, a correction factor has been applied to ensure that most values fall between -100 and 100, thereby providing some guidance. CCI is based on price only, suggesting it is a lagging indicator, but its design is intended to provide trade signals (buy or sell), making it have the properties of a leading indicator.
2. Key points
- The Commodity Channel Index (CCI) is a technical indicator that measures the difference between the current price and its historical average share price.
- When the CCI is above zero, it indicates that the current price is above the average of 20 trading days. When the CCI is below zero, the price is below its average.
- The CCI is an unbounded oscillator, meaning it has no minimum or maximum value. A correction factor is applied to make most values fall between -100 and 100.
- Overbought and oversold levels are typically determined for each individual share by identifying historical CCI levels that showed a price trend reversal. This approach determines if the thresholds of -100 and 100 can be used.
- A value of above +100 indicates a rising price trend (bullish), while a value of below -100 suggests a falling price trend (bearish)
- The main challenge with the CCI is interpreting the reference values correctly, as no direct signal values are available but the +100 and -100 are suggested references.
3. CCI calculation and formula
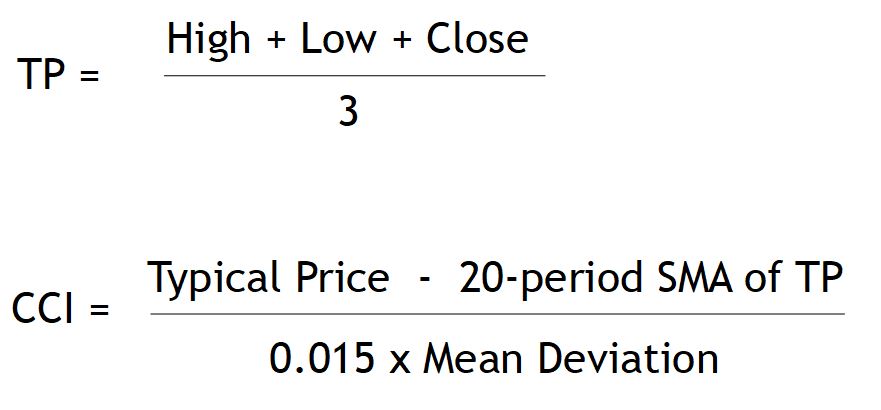
The calculation of CCI only makes use of share price. It compares the typical price of a trading day to the moving average of 20 trading days. A formula is applied to create an oscillating function. The oscillator is in contrast to other technical oscillating indicators, not bound by limits. To ensure that most values fall within a readable window, a correction factor has been applied. The correction value of 0.015 is used, resulting in roughly 75% of all values falling between the values of -100 and 100. When CCI is above zero, it indicates that the price is above the reference average of 20 trading days. When the CCI is below zero, the price is below the reference average.
The steps for calculating the CCI are:
- Calculate the typical price (TP) by averaging the high, low and close for each day.
- Determine the moving average (MA) of the typical price over 20 trading days.
- Calculate the mean deviation by subtracting the MA from the typical price
- Calculate the simple moving average (SMA) of the absolute values (ignore minus signs) of these differences over 20 trading days.
- Use the most recent typical price, MA, and mean deviation into the formula to compute the current CCI.

4. Insights provided by the CCI indicator
The CCI is used for identifying new trends, with a focus on overbought and oversold levels. In addition, a lack of strength in a price trend can be uncovered when the indicator diverges from its price.
When the CCI shows a high positive value (preferably above 100), it could indicate that a new uptrend in price is starting. When this occurs, there could be a pullback in price followed by a rally in share price and CCI, which could act as a signal indicating a buying opportunity. The same principle applies to an emerging downtrend. When the indicator changes from positive to below (suggested) -100, a signal for a downtrend is indicated that could result in falling stock prices.
The signal for overbought or oversold levels are not fixed, as the indicator is unbounded between a minimum and maximum score. Past price reversals with their associated CCI values could provide an indication of which values should be used as a reference. For one stock, there could be a tendency to change trend near +100 and -100 while another stock could reverse around +200 and -150. Therefore, it is suggested to look back at its history what the relative levels that is signaling a rise of fall in the price trend of the share price.
Another signal to identify are divergences in which the price is moving in the opposite direction of the indicator. If the share price is rising and the CCI is falling, this could indicate a weakness in the trend and could possibly be of short duration. However, there could be a breakthrough and then the CCI moves in line with the trend again. While divergences can last a long time and doesn’t always result in a price reversal, it is useful as a warning for the possibility of a reversal and as a action for the trader to assess its risk.
5. Limitations
The CCI is used mostly to identify overbought and oversold conditions, but there are limitations to its use. The indicator has no reference values (minimum and maximum limits) or fixed range, making interpretation not straightforward. This means that a previous value that corresponded to an overbought or oversold signal (and showed a price reversal) should not be interpreted in the same manner, as potentially, a different threshold could apply in this new situation. This makes the indicator much more cumbersome and not as straightforward to interpret and provide an indicative trading signal as for example the Money Flow Index (MFI) or Relative Strength Index (RSI).
Because this technical indicator is based on price only, it is considered to be lagging. This means that the CCI indicator could give a signal, but the new trend has already started, meaning that the trading opportunity has already passed. Whether this has happened is up to the interpretation of the trader.
6. Practical example
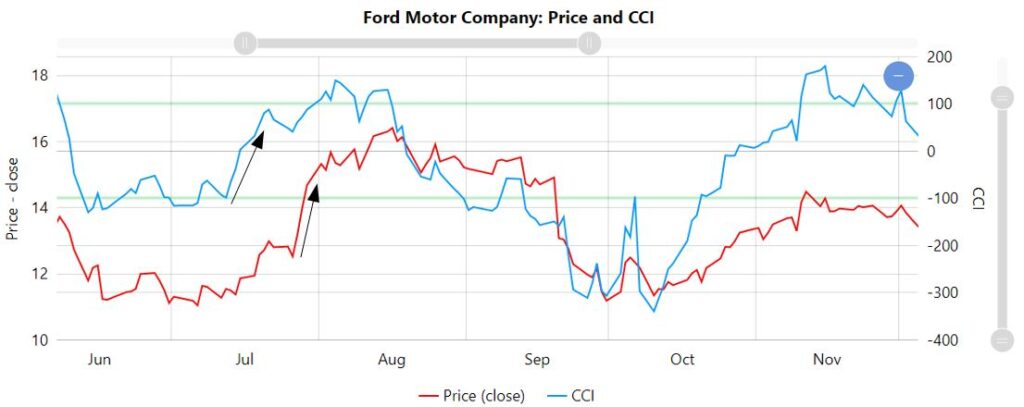
An example of the CCI indicator in practice can be found by observing the price development of Ford Motor Company. In July there is an increase in CCI while the price increases modestly (see arrow in the image below). This is followed by a sharp increase in price. However, during this price increase, the CCI remains relatively flat. This is a clear example in which the CCI acted as a precursor to a price increase.

It can be seen that in general the CCI follows the same pattern as the price and often overlaps. However, because it is unbounded, the actual rise does not have to correspond directly to the same level of price change. In the graphs it can be seen that at several points false signals were provided.
7. The difference between CCI index and Stochastic Oscillator
The similarity between the CCI Index and the Stochastic Oscillator is that both are oscillators and make use of the high, low and closing price. However, the way they use them in the calculation is different, otherwise they would produce the same value and indication. This difference lies within the used time period to determine the reference price. The CCI uses the average of 20 trading days and the stochastic oscillator the high and low of the last 14 trading days. Furthermore, the CCI uses the typical price of the trading day, while the stochastic oscillator uses the closing price. The interpretation of the two indicators is also different. The stochastic oscillator is bound between zero and 100, while the CCI is unbounded. In practice the stochastic oscillator has a different shape showing many more fluctuations. Due to these differences in calculation, boundaries and fluctuations, both provide different signals at different times.
8. Using CCI on StoCoTo
The StoCoTo platform makes use of CCI in the analysis of the individual stocks. Because its value is not bounded by limits, different stocks cannot be compared directly using the CCI value.
On the individual company stock pages the CCI is plotted against the share price over a minimal time period of one year. The intended reference lines of -100 and 100 are added to provide some guidance. This allows the trader to observe historical price changes in relation to the trade signals provided by CCI and provide some guidance if the added thresholds have any value. As all graphs cover the same timeframes, it is possible to check the behaviour of other technical indicators around the same time point.
9. A word of caution
Technical indicators have been around for many years and this prolonged existence make a good cause for using them. But it should be noted that the CCI indicator is a historical parameter and does not predict the future. Furthermore, the CCI indicator calculates trading activity and does not directly indicate the price direction of a stock. Therefore, relying on one indicator is not good practice and a better approach could be to combine it with other sources of information to analyse a stock and assess its associated risks. In addition, developing a trading strategy that includes technical indicators and reviewing the performance and learnings of this strategy is more likely to lead to good results than relying only on a single indicator.
10. Other relevant articles on StoCoTo
Read more about the Commodity Channel Index in The Big Manual
Other cumulative indicators are: Volatility, OBV and A/D Indicator
Other technical indicators based only on price are: Volatility, RSI, MACD and Stochastic Oscillator
#commoditychannelindex #cciindicator #cci #overbought #oversold #technicalanalysis #technicalindicators #tradingsignals #momentumindicator #ccicalculation
