A leading indicator that combines price and volume
Author: Berry Matijssen
Reading time: 6m:46s
Updated: 22 March 2024
Content
1. The Money Flow Index in a nutshell
The Money Flow Index (MFI) is a momentum indicator that uses the price and volume of a stock trade (combined: the money flow) to measure the enthousiasm of the market. This means it provides an indication of how much money was used to trade the stock. It is used to identify overbought or oversold signals for a stock. It can also be used to identify divergences (between price and MFI) which serves as an indicator of a change in price trend (up or down). The MFI has the shape of an oscillator and moves between 0 and 100. The MFI is strongly related to the Relative Strength Index (RSI) and is considered by investors to be a leading indicator. It is used in combination with other market insights to make trading decisions.
2. Key points
- The Money Flow Index is designed to measure the ‘enthousiasm’ of the market.
- It is a leading technical indicator in the shape of an oscillator ranging between 0 and 100 and is used to identify overbought or oversold signals based on a combination of price and volume (the money flow).
- An MFI below 20 is considered oversold (signalling a buy) while above 80 it is considered overbought (signalling a sell).
- A divergence between the MFI and price can be interpreted as a signal that a change in the current price trend is about to happen.
- The MFI can be used to measure the strength of a price trend. If a strong trend is seen, but MFI responds moderately, the price trend might not be strong.
- A change from the MFI crossing a threshold and shortly moving back over the threshold could indicate a continuation of the price trend.
3. MFI calculation and formula
Several steps are required to calculate the MFI. The standard approach uses 14 periods which corresponds to 2 weeks. However, trading data is not always the same in two weeks as the stock market can be closed for a day. This means that sometimes a 14-day period has 10 trading days, but other times it has 9 trading days. This also means that the number of positive and negative trading days can be out of balance. Therefore, in this calculation 10 trading days are used (and not 14 days) to determine the MFI. To establish the trend over time it should be calculated for each trading day. The following steps are used for calculating the MFI:
- The typical price is calculated for each of the last 14 periods. (see formula typical price) by taking the average of daily high, low and close.
- For each period, it is identified if the typical price was higher (positive) or lower (negative) than the previous period.
- The raw money flow is calculated by multiplying the typical price by the volume for that period. A negative or positive number is applied depending on whether the period was higher or lower. (see formula Raw Money Flow)
- The money flow ratio is calculated by adding up the positive money flows over the last 14 periods and dividing it by the negative money flows for the last 14 periods. (see formula Money Flow Ratio)
- The money Flow Index (MFI) is calculated using money flow ratio. (see formula Money Flow Index) to generate the oscillator shape.
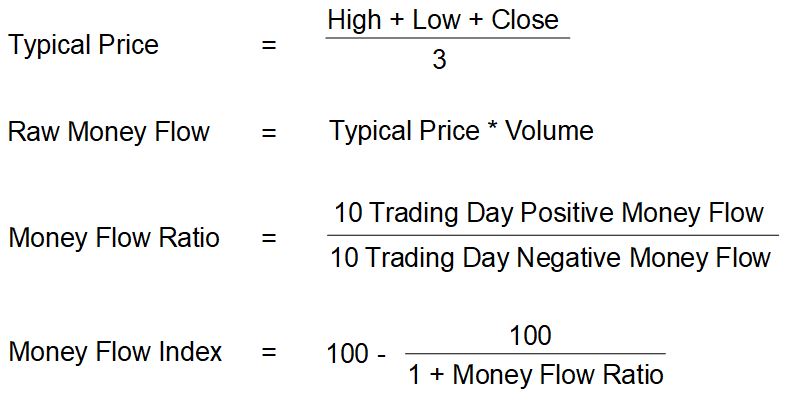
Regarding the positive or negative money flow, the difference between the typical price of the current day and the previous day is important. If the current typical price is higher than the previous day, it is added to the positive money flow and vica versa for the negative money flow. This means that the raw money flow (price*volume) can increase on a day compared to the day before, but stilll it adds to the negative money flow (because the typical price goes down).
A few things must be taken into consideration. Firstly, the MFI can only be calculated at the end of the day as it uses the high, low and close of a single trading day. Prices during the day do not make sense and can influence the calculation. Secondly, when 10 trading days are all positive or negative, in theory the Money Flow Ratio cannot be calculated because dividing by 0 does not work. In that case a value of 0 or 100 is assigned to the MFI.
4. Insights provided by the Money Flow Index
The MFI is used to identify overbought and oversold levels in the stock market. Ideally, the thresholds of 10 (indicating oversold) and 90 (indicating overbought) are used as signals. Unfortunately, these events rarely occur and, therefore, the thresholds of 20 and 80 are used to signal that the price trend is reversing. There is some controversy over the exact thresholds as these could vary based on market conditions or be stock-specific. It is possible for a stock to hold an above-threshold MFI during a strong trend in which the price increases. Therefore, the thresholds are better considered guides to identify trading opportunities than exact signalling levels.
Another use of the MFI is to identify a divergence between price and MFI which could signal of a potential reversal in the current price trend. When the price is still rising and MFI begins to fall, this could signal the end of the current trend of price increases. Similarly, when the price is still falling, but the MFI is increasing, prices could increase again.
The MFI can also be used as an indication of the strength of a price peak. If a price sees a new high, but it is not accompanied by a high MFI seen by previous price peaks, this new price might not be as strong and could possibly reverse.
The MFI can be used to identify a continuation of a price trend. If prices increase, but MFI falls below 20 for a short time but increases to above the 20 threshold, this could be an indicator that the stock price keep increasing.
5. Limitations
It is clear that the MFI is an useful indicator that can identify price reversal trends and provide an indication about the strenght of current price trends. This would highlight opportunities for trading. However, it is not without flaws. It should be noted that values below of above the threshold can occur without a change in price trend as MFI levels can move to the other side of the threshold value. This is known as a false signal and can have different shapes as a price trend can continue or becomes flat while the MFI signal would indicate a trend reverse.
Apart from providing a false trading signal, it can miss a signal as not all new trends are derived based on responses to trade volume and price. This is not always problematic when a share price increases but could have negative consequences when it declines.
A final drawback is the occurence of lagging behaviour. This happens when first the price trend changes and afterwards a change in the MFI signal occurs. In this case, the trading signal is of limited value as the buying or selling opportunity is likely to have largely passed.
6. Practical example
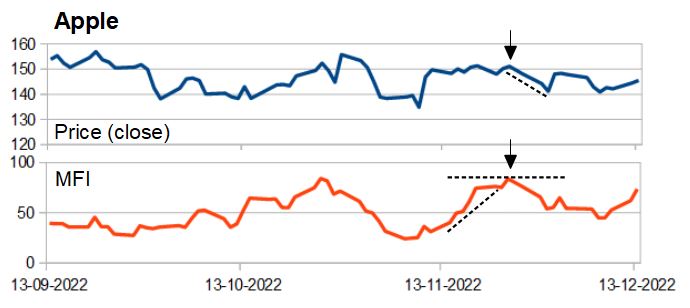
The use of the MFI threshold can be shown using Apple. At the end of November 2022 the price of the share is flat, but there is an increase in the MFI. At the peak of the MFI the price goes down as does the MFI. It can be seen that the share price shows a similar pattern. This allows an investor to identify a divergence between price and MFI and explains why the threshold (in this case) causes a drop in price.
7. Difference between the MFI and the Relative Strength Index
The MFI and Relative Strength Index (RSI) are closely related as both are based on an oscillating function and use a similar approach in the calculation by using the up- and down-days. The difference is that RSI only uses price, while the MFI also includes volume. Therefore, the MFI is sometimes referred to as the volume-weighted RSI. Traders that prefer volume-based analysis regard it as a leading indicator. This suggests that MFI has an advantage that provides a better indication of a possible price trend reversal than RSI, but in practice both have their own unique behavior.
8. Using MFI on StoCoTo
The StoCoTo platform makes use of MFI in multiple ways. The first are the analysis pages in which stocks in market indexes or sectors are compared. A chart is available in the trading opportunity section where it is compared to RSI. For both indicators a reference line is available. These two are commonly used as signals indicative for buying and selling. An advantage of multiple stocks in one graph is the comparison to other companies. The second is the individual company stock pages. Here, the MFI is plotted against the share price over a minimal time period of one year. This allows the trader to observe historical price changes in relation to the trade signals provided by MFI. It is also possible to check the behavior of other technical indicators around the same time point.
9. A word of caution
Technical indicators have been around for many years and this prolonged existence make a plausible reason for using them. It should be noted that the MFI can produce a false signal. Crossing a threshold can indicate a change in price trend, but moving the MFI back from the threshold can indicate a continuous price trend. The existence of this effect can only be established at a later time when it has passed. Therefore, relying on one indicator is not good practice and a better approach could be to combine them with other sources of information to analyze a stock and understand risk. In addition, developing a trading strategy that includes technical indicators and reviewing the performance and learnings of this strategy is more likely to lead to good results than relying on a single indicator.
10. Other relevant articles on StoCoTo
Read more about the MFI in The Big Manual
Other oscillating indicators are: CCI, MACD, RSI and Stochastic Oscillator
Other technical indicators combine price and volume are: A/D indicator
#moneyflowindex #MFI #technicalanalysis #tradingsignals #momentumindicator #overbought #oversold #technicalindicator