A lagging indicator based on price
Author: Berry Matijssen
Reading time: 4m:27s
Updated: 8 November 2024
Content
- MACD in a nutshell
- Key points
- MACD calculation and formula
- Insights provided by MACD
- Limitations
- Practical example
- MACD compared to the Commodity Channel Index
- Using MACD on stocoto
- A word of caution
- Other relevant articles on StoCoTo
1. MACD in a nutshell
The Moving Average Convergence/Divergence (MACD, or MAC-D) is a momentum indicator that shows the relationship between two moving averages (EMAs) of a share price. To derive a trading indicator, a signal line is added.
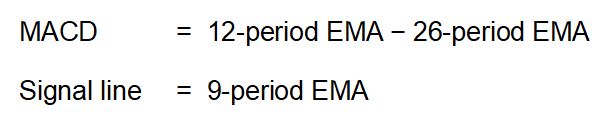
The MACD line is calculated by subtracting the 26-period exponential moving average (EMA) from the 12-period EMA. The MACD line is used in combination with the signal line. This is the nine-day EMA derived from the MACD, which is compared to the MACD line.
The comparison of both lines can function as a trigger for buying or selling. A trader could consider buying a stock when the MACD line crosses above the signal line and selling the share when the MACD line crosses below the signal line. MACD indicators can be challenging to interpret, with events such as crossover divergences and rapid rises or falls being most common.
A fast EMA will respond more quickly than a slow EMA to changes in a price of a share. By comparing EMAs of different periods (day count), the MACD can identify changes in the trend of a stock. Convergence means that the MACD- and signal-line move together, while if they move apart it is referred to as divergence. It has been suggested that the divergence series can reveal subtle shifts in the trend of the stock price.
Because it is based on moving averages, it is considered a lagging indicator. However, it is intended as a signal for buying or selling and, therefore, also a leading indicator.
2. Key points
- The moving average convergence/divergence (MACD, or MAC-D) line is calculated by subtracting the 26-period exponential moving average from the 12-period EMA. The signal line is a nine-period moving average derived from the MACD.
- MACD is often used with a setting of 26-12-9 days is the norm. However, this is difficult to mimic as it was based on a 6-day trading week, whereas nowadays, it consists of 5 days. Alternatively, a setting of 22-10-7 days can be used.
- It is considered to be a lagging indicator because it is based on moving averages, but also leading as it identifies trading opportunities.
- A technical signal is provided when the MACD line crosses above the signal line (buy) or falls below it (sell).
- A zero-crossover is considered bullish (buy) when it is above zero, but bearish (sell) when it crosses below zero.
- The MACD/signal line and zero-crossover signal do not always provide the same trading signals.
- MACD can help identify if a share is overbought or oversold by assessing the strength of the directional move and indicate a possible price reversal.
- The MACD can indicate price divergences (e.g., when a new high in price is not confirmed by a new high in MACD, and vice versa), suggesting a price reversal.
- A limitation of MACD is its ability to produce a false signal (e.g., a crossover does not lead to a price change) or that a price reversal is not identified by a crossing of the MACD/signal line.
3. MACD calculation and formula
The analysis of the MACD is based on two values: MACD and the signal. They are calculated separately and then compared in a graph. The exponentially moving average (EMA) is used in all calculations. The following steps are taken for the standard calculations:
- The MACD is calculated by subtracting the long-term EMA of 26 periods from the short-term EMA of 12 periods.
- The signal value is calculated taking the 9-period EMA of the MACD
The exponential moving average is also referred to as the exponentially weighted moving average. An exponentially weighted moving average reacts more significantly to recent price changes than a simple moving average (SMA), which applies an equal weight to all observations in the period.
In this tool a change has been made to the original MACD which makes use of an exponential moving average and the 26-12-9 periods in the calculations to reflect the original principle to modern times.
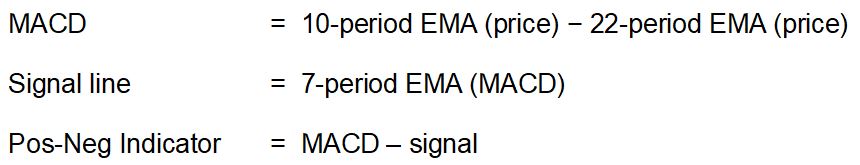
The original MACD uses periods of 26, 12 and 9 days. However, when it was introduced, a normal trading week had 6 days. This corresponds to 1 month, two weeks and 1,5 weeks. This has changed and currently a trading week consists only of 5 days. To complicate it further, the stock market can be closed due to national holidays. This means a perfect representation of the MACD is not possible. This tool uses 22, 10 and 7 trading days. The 22 trading days represents one month, and two weeks is accounted for in 10 trading days. For 1,5 weeks a choice needs to be made between 7 or 8. Because the 7 is further away from the 10 trading days, it is more likely to provide a stronger signal and, therefore, the value of 7 is chosen as a parameter.
An additional Pos-Neg indication can be provided if the last MACD value is above the signal value (positive) or below the last signal value (negative).
Based on the change in trading days, it can be stated that the original MACD does not exist any more and cannot be replicated. Therefore, all calculated MACD are not as intended and modified from the original. By using shorter time-periods, the MACD presented here can be considered modified but strongly related to the original and intended to provide the same insights.
4. Insights provided by MACD
The MACD lines do not have fixed levels for overbought and oversold signals like the RSI and MFI. Instead, they are based on comparing the two values (MACD and signal). Although the current state (negative or positive) is important, it is also worthwhile to focus on the level and direction of the two lines in relation to the recent price movements of the selected share.
When the MACD and signal-line cross, it is referred to as a signal-line crossover. In this situation, the divergence changes from negative to positive or the other way around. The most common interpretation is a recommendation to buy if the MACD line crosses up (positive) through the signal-line (bullish), or to sell if it crosses down (negative) through the signal-line (bearish). This crossing event is considered an indication that the trend in the stock price will continue in the direction of the crossover.
A zero-crossover event occurs when the MACD series crosses the horizontal zero axis. This happens when there is no difference between the fast- and slow-moving averages of the price series. A change from positive to negative MACD is interpreted as bearish, and from negative to positive as bullish. Zero crossovers provide evidence of a change in the direction of a trend but less confirmation of its momentum than a signal line crossover.
5. Limitations
Similar to other technical indicators, a limitation with a moving average divergence is that it can signal a possible reversal, but then no actual reversal happens. This is referred to as a false positive and can happen regularly, especially when a floor or ceiling is broken through. The reason behind this is largely because the MACD is a technical indicator based on share price and does not take into account business developments at a company or political events.
The other limitation is that divergence does not forecast all price reversals. This means that a price reversal occurs, but there is no signal in the MACD/signal lines. This is unlikely to be a problem if the price of a stock keeps rising, but not having a signal that indicates the fall in share price could be a risk to the portfolio.
Because it is based on moving averages, it takes time to develop a trading indicator. Often the last day values (or price change) is not strong enough to influence the lines. This means that often it provides a late trading signal (but perhaps stronger) and the MACD indicator is not suitable to identify events such as a price swing into an uptrend early.
6. Practical example
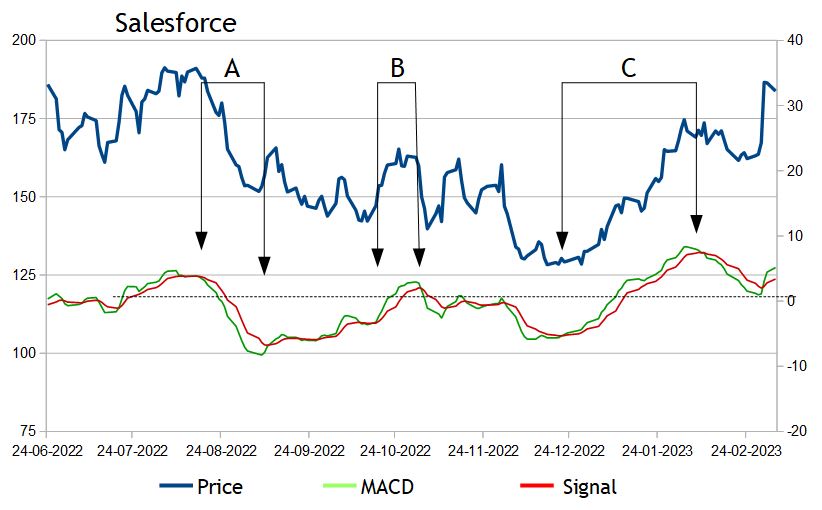
Using the price behaviour of the stock of Salesforce, an insight into the workings of the MACD in practice can be obtained by plotting the three different lines (share price, MACD, signal) in the same line chart. Three scenarios from the total time are selected to indicate the relation of the technical indicator to the share price movement:
A) drop in the share price
B) short-period increase in share price
C) long-period increase in share price
The drop in share price (scenario A) shows the MACD line moving below the signal-line. This remains until the price starts to increase again, until the MACD and signal-line start to match each other. In this example, the MACD clearly indicates a downtrend.
Similar to scenario A, an increase in share price (scenario B) shows the MACD-line moving above the signal-line, thereby indicating an uptrend, and subsequently the share price increases until the two cross again.
The long-term price increase (scenario C) shows a MACD line that is constantly above the signal-line in line with the uptrend. However, it should be noted that halfway these two lines become very close (converge) but move away from each other (diverge) again.
As a sidenote, there are several periods shown in which the MACD and the signal-line overlap with each other and cross regularly. These should not be overinterpreted as a clear signal for purchase or selling.
7. MACD compared to Commodity Channel Index
The similarity between the MACD and the Commodity Channel Index (CCI) is that both are based on price and do not have a reference value seen in other indicators that move within a bounded range. Despite the similarities, the calculation of both technical indicators is different.
MACD uses a set of moving averages derived from closing prices and calculates the difference between them. CCI uses typical price (includes low, high and close) to represent price changes within the day and compares the current closing price with the moving average.
These calculations suggest that the MACD is slower in providing a signal as it uses moving averages which take time to develop and CCI is a faster indicator as it uses current price. This would also suggest that the MACD signal could be considered a stronger signal, but lags in identifying the price swing point. It should be noted that both indicators can provide false signals for overbought and oversold.
8. Using MACD on stocoto
The StoCoTo platform makes use of MACD in the technical stock analysis of individual pages. The MACD and signal line are plotted against the share price over a minimal time period of one year. A reference line at the value of zero is added to provide some guidance. This visualization allows the trader to establish the current signal that the MACD provides. In addition, the historical price changes in relation to the trade signals provided by MACD show an indication of its relevance. To establish a stronger technical trading indication, it is possible for the trader to check the behaviour of other technical indicators around the same time point in a fast manner as the different graphs cover the same timeframe.
9. A word of caution
Technical indicators have been around for many years and this prolonged existence make a good cause for using them. But it should be noted that the MACD is a historical parameter and does not predict the future. Furthermore, MACD measures moving averages of price and does not directly indicate (or predict) the direction in which a stock price moves. Therefore, relying on one indicator is not good practice and a better approach could be to combine it with other sources of information to analyse a stock and assess its associated risks. In addition, developing a trading strategy that includes technical indicators and reviewing the performance and learnings of this strategy is more likely to lead to good results than relying only on a single indicator.
10. Other relevant articles on StoCoTo
Read more about the MACD in The Big Manual
Other oscillating indicators are: CCI, MFI, Stochastic Oscillator and RSI
Other technical indicators based only on price are: CCI, Stochastic oscillator, RSI and volatility
#macd #variance #movingaverage #technicalanalysis #technicalindicators #tradingsignals #laggingindicator #leadingindicator