Author: Berry Matijssen
Reading time: 7m:31s
Updated: 10 November 2023
Index
1. Introduction to singles in the USA
2. Distribution of singles by age
3. Combining the singles into partner availability
4. Conclusion on age and partner availability
5. References
1. Introduction to singles in the USA
Most people get involved in a relationship to find happiness in life. Despite the fun and excitement during dating, it is always challenging to find that special one. As a result, many start to wonder how difficult it is to meet this special person. Especially as we get older, the question arises if this becomes more difficult or that it is just our perception. This article attempts to put some numbers on this challenge and get a factual understanding of the world of dating and its link to age.
In principle, if the number of available candidate partners could be determined it is possible to derive how difficult it is to find a partner. This partner availability could be quantified by the number of available single men and women and worked out as a ratio. This provides an insight into the ‘availability’ of potential partners for each age and use this to determine the challenge in dating.
The paper ‘A profile of single Americans’ provides several useful numbers. It has the percentage of singles by age-group and the percentage of singles that are looking for a partner by age group. As the age group is not even distributed, the number of people in each age group is taken from Statista and both data are combined. All data is from the USA, so there are likely to be differences with other countries, but in general a similar trend is expected.
A few modifications need to be made to the data because there is not data for each age, but it is available for age-groups that are large. As there are significant differences between each age group, a linear interpolation is applied to get a smooth transition. This is shown in the graphs by a flat bar (that is the reported value) connected by a line between two points (that is interpolated). These graphs are shown in later sections. Despite the required modifications, a decent insight into the different properties by age are obtained.
One of the generally accepted ways of establishing the pool in which to find a partner is the age group of the opposite gender. In general, women tend to date someone who is a few years older, and men date a woman that is younger. This is not an exact science, but for the representation of the dating pool for women the target males are set to 0-5 years older. For men, the female age group of the availability pool will be 0-5 years younger.
This approach is not perfect, but as an approximation it is suitable. Most likely, when larger age ranges are taken, it will provide a similar outcome. There can be differences between regions (city or countryside) and religion, but these are ignored in this approach. The goal is to obtain a general view. Lastly, modern society has a whole new range of dating behaviors. This dating simulation ignores the LGBT+ community and also the sugerdaddy and sugarmommy activities. Everyone is entitled to find their own happiness, but on a larger scale the traditional man/woman relationship within a certain age range is still dominant and is presented here.
As a small sidestep, there is a view in society that all men are into woman who are much younger and that women have difficulty competing with these girls as they get older. The reverse exists as woman are supposedly into wealthy men with a strong jawline. This results in men showing off fake wealth and a subscription to the gym. In reality, these views are not true as society would largely consist of singles as these requirements only a few can meet. Just like everybody wants to live in a luxury villa, drive a premium car, and go on an exclusive holiday, expecting everyone to find a partner that matches this overidealized view is not reality.
1. Distribution of singles by age
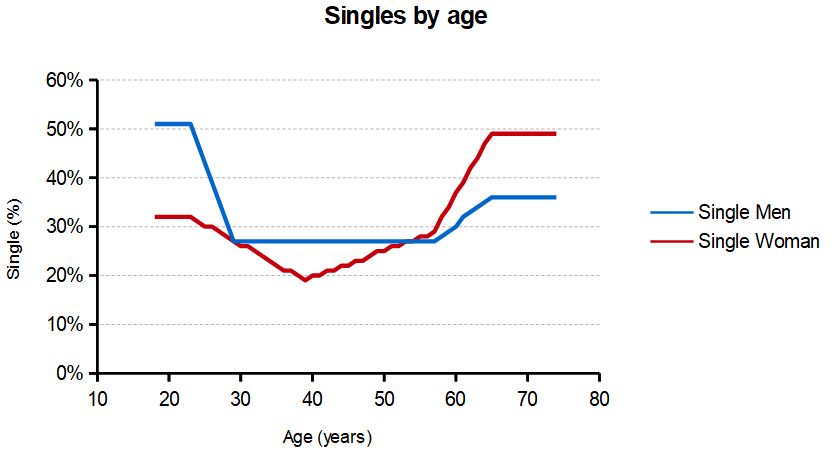
The first feature to understand is the number of single men and women by age. The graph (see below) shows some clear results. There are many more single men than women at the age of 20 and this imbalance remains up to the age of 55. This can be explained by women tending to date men that are a few years older, thereby having a bigger pool. For men at the age of 20, dating women that are five years younger is controversial. This age-pool benefit tends to stay with woman for a longer time. Around the age of 30, there appears to be an equal amount of singles for both genders, but afterward declines further for woman. This matching is partly an artifact of the data as it is interpolated, but also part of the results in the original paper. At the age of 40 both groups have the lowest single rates. After the age of 55 there are more single women than men. A potential explaination could be the combination of men having a shorter life expectency while woman dating older men, but it is unsure if these assumptions hold up.

2. How many men and women are looking for a partner
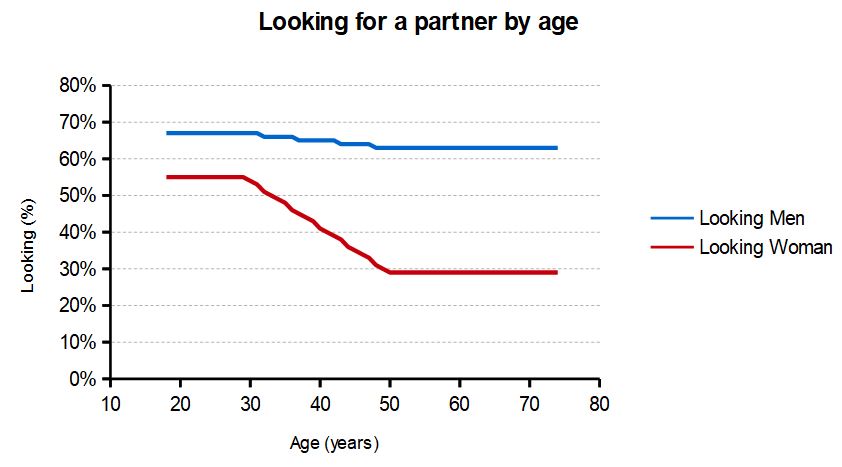
The next insight is about how many of the single men and women are looking for a partner. The data in the graph shows a clear difference between both groups. The majority of men are looking for a woman and this ratio declines only slightly over the years. So both young and older single men have a similar desire to meet a partner.
This is different for women. Up to the age of 30 the desire for a partner is high, but after that it starts to decline and reaches a low around the age of 50. At this point, only a disappointing 30% of single women are still looking for a partner.
The willingness to look for a partner is a personal choice, but it is clear that women have an edge here if they are into the dating-game. In an equal group, if a woman is looking for a partner than there are many more men who are looking for a partner. For the male person this is the opposite. Competition amongst men is high while the availability of women that are looking for a partner is low.

3. Combining the available singles into partner availability
The numbers of available singles and willing to date can be combined into an availability ratio. This is determined by taking the number of males, multiplying it by the single ratio and as a last step multiply it by the looking-for ratio. For man, the woman who are in the same age and 5 years younger are selected as the candidate-pool while for women, the men that are the same age and 5 years older are placed in the candidate-pool.

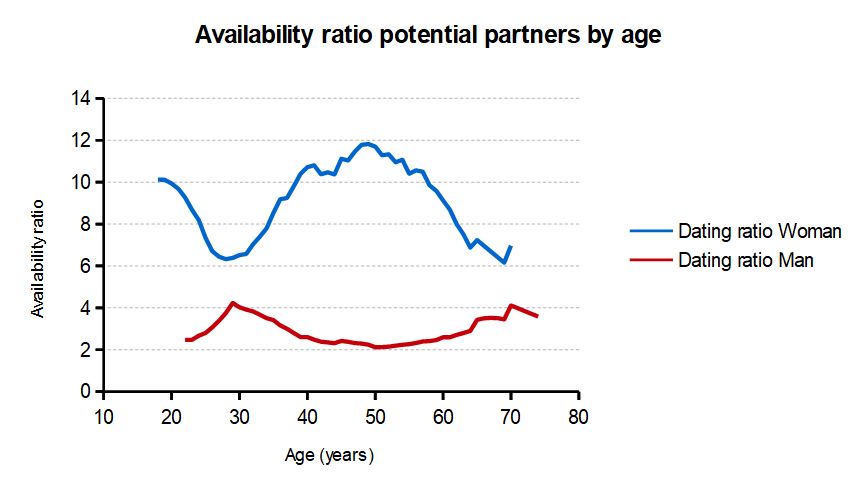
With these calculations, it is known how many men there are in an age-group (e.g. age 43) and potential partners in the corresponding female group (e.g. age 39-43). The ratio between both can be determined, which in this case is 2.3 meaning that for every 43-year-old-single-willing-to-date-man there are 2.3 39-to-43-year-old-single-women-willing-to-date available.
The outcome is remarkable. For woman this means that their early peak of around ten available potential partners at the age of 20 is unlikely to be matched in the next 20 years. Despite this, their ratio is always favorable. This is simply due to the higher number of single men and fewer women looking for a partner. It can also be seen that at the age of 40 their level of available partners is just like when they were young and stays at this level until the age of 60. Because women tend to grow older and date older man, there is an increase in available women.
For men finding a partner is more difficult, as most of the time there are only 2 potential candidates for each man. However, at the age of 30 they grow closer to each other. This is driven by a high percentage of women wanting a partner and fewer single man available. A nice touch is that at the end of a man’s life the number of available female partners to male increases again.

4. Conclusion on age and partner availability
There is no doubt that young women are spoiled for choice when they enter the dating world. Despite their dip around the age of 30, women who are looking for a partner always have more choice than men. This is simply because fewer of them are single and fewer of them are willing to look for a partner. For men life is just tough, but at the age of thirty they have a good shot at finding a partner and at retirement there are many available women to spend their hard-earned free time with.
As a last note, dating success does not only depend on partner availability, but also on meeting them. In our young ages this happens naturally as it is easy to get in contact with each other during our education or at parties. This changes when we start working which is a much more diverse place and as we get older, our entertainment changes. The research from PEW shows that many of us still meet at parties or through friends. The suggestion is that the best thing to do for both men and women who are looking for a partner is to hang out with many of your friends or go online.
5. References
A profile of single Americans
Anna Brown
PEW Research Center, August 20, 2020
