A leading indicator based on volume for trading activity
Author: Berry Matijssen
Reading time: 3m:39s
Updated: 8 March 2024
Content
- Volume in a nutshell
- Key points
- Volume calculation and formula
- Insights provided by volume
- Limitations
- Practical example
- Trade volume compared to other indicators
- A word of caution
- Other relevant articles on StoCoTo
1. Volume in a nutshell
In stock trading, volume refers to the number of shares of a company that are traded in a single day between its open and close. Traded volume, and changes to volume over time (usually several days), are important inputs for technical traders as it measures the activity and interest of a certain company. Volume is not calculated as it is directly available. To calculate the trade-value (or money flow), volume and price can be multiplied. In addition, a relative trade volume can be calculated to determine how much (%) volume is up or down. As price is often the result of trading activity and volume is the ‘behaviour’ of traders, thereby creating market activity, it is considered a leading indicator.
2. Key points
- Volume is the number of shares of a company traded during a given period of time, usually a single trading day.
- Trade value (money flow) can be obtained by multiplying volume by its price.
- In general, shares with higher daily volume are considered more liquid because they are traded more actively.
- Volume is a leading indicator in technical analysis because it is used as an insight to the relative significance of a market price change.
- Higher trade volume during a price move makes it more significantly, while lower trade volume makes the change less significant.
- When price falls on increasing volume, the trend is gathering strength to the downside.
- When prices reach new highs (or no lows) on decreasing volume, a reversal might be about to happen.
3. Volume calculation and formula
Volume is a directly measured activity. Therefore, the number of shares that change hands between buyers and sellers is not calculated but an actual value. There is no difference between buying and selling volume because each share needs to change hands between a seller and a buyer.
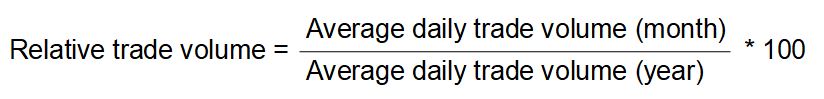
To compare the current trading volume with its overall volume, a comparative value can be determined. The relative volume is calculated by dividing the average volume of the last month by the average volume of the previous 12 months. The resulting fraction is the relative trade volume.
In addition, trade value can be calculated. This is performed by multiplying the volume by its price. Unfortunately, each exact trade-price is not available as they vary during the day. To take an average, the day close is used to achieve the trading price. To compare the trade-value between different companies, the trade-values of 20 trading days can be calculated. This provides a reliable comparison in which effects that occur during the day are ignored, but larger trends are visible.
4. Insights provided by volume
Volume provides traders an insight into the activity and liquidity of a company. Higher trade volume for a specified share means better liquidity and a more active market, making it easier to buy or sell. In general, volume tends to be higher near the market’s opening and closing times, and on Mondays and Fridays. It tends to be lower around lunchtime and before a holiday. It should be noted that this level of detail in trading volume is often not available as delays can occur, making it difficult to actively use this data.
Volume is an important indicator in technical analysis due to its use as a measure to determine the significance of a market move. If the stock price changes a large amount during a given period, the strength of that movement is supported by the volume for that period. The higher the volume during the price move, the more significant the move is considered to be. In contrast, if volume is low during this price change, then the move is considered as less significant.
This works for both the support level (floor) and the resistance level (ceiling). If a price reversal from either value occurs, this is likely to be accompanied by a high trade volume. However, if trade-volume is low when this price change occurs, it can be considered to be of less importance. In reality, there is not only low- and high-volume trading, many different levels in between. To make it more complicated, a price change is not spread equally with a defined start and end.
In a rising or falling market, it is possible to observe exhaustion moves. These are generally sharp moves in price combined with a sharp increase in volume. This signals the potential end of a trend. Traders who waited to buy and are afraid of missing the price increase step in when the market tops, thereby exhausting the number of buyers.
Volume can also suddenly increase based on news. In the case of good or bad news, the change in trade volume is a result of a known factor and could start a new trend. If unexpected news does not lead to increased volume, this could be an indicator that trust in the company remains.
5. Limitations
Compared to other technical indicators, volume itself has no known limitations as it is a result of an actual activity. However, derivates of volume can be influenced by certain effects. If there is a sudden spike in volume this could be present for a long time while its influence has already been gone.
The other limitation is that human behaviour is not always rational. The response of traders to news (good or bad) can result in large volume being traded. This does not always correspond to the real impact of the news. The perception of the impact of news to traders plays a large role.
A last point to mention is that volume can spike significantly. Especially after announcing results traders can decide to take profits and sell their position or see it as a good moment to step in. These spikes could result in showing that a stock will trade above average for a while when volume has already returned to normal.
6. Practical example
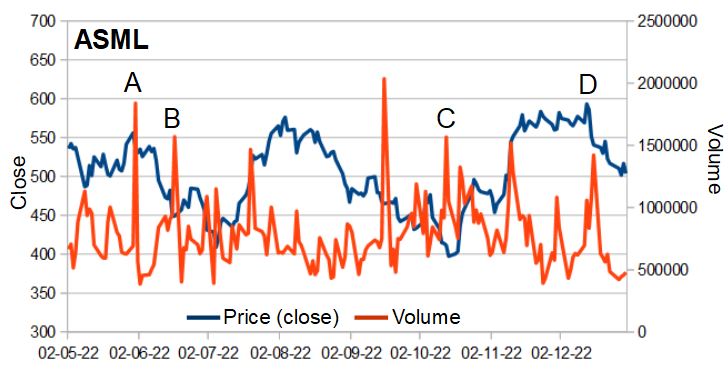
An example of the relationship between volume and price can be seen when plotting these two values for ASML against each other over time. Note that it is not only volume that determines the price change as business development, financial performance and news has an impact as well.
Using the graph below there are four points that were identified in which volume can be linked to price:
A) The price has reached a new high. Most like the ceiling level. This sees a large peak in volume and several days later the price goes down.
B) Price hits a low (floor) and high volume is observed, and the price rises afterwards.
C) This shows the lowest price in the whole period. After a peak in volume the price goes up again.
D) After a relative stable price level, a peak in volume in seen followed by a decrease in price.
Despite these clear links between volume and price, it should be noted that other signals exist. This indicates that not only volume is responsible for a price change. These finding are:
- Not all peaks in volume result in a price change or a change of direction in price.
- Volume is changing all the time, there is not a prolonged period with low-volume trading.
7. Trade volume compared to other indicators
Volume itself is a purely lagging indicator as it reports how many shares have been traded. It can be combined with the share price resulting in the money flow of a stock, provided more insight, but it remains a reported indicator of an activity. However, volume is regarded as a leading indicator, as increased volume can be a seen as a precursor to a price change. The main difference with other volume indicators such A/D indicator, MFI and OBV is that it doesn’t produce an interpretable trade signal.
8. A word of caution
Technical indicators have been around for many years and this prolonged existence make a good cause for using them. But it should be noted that volume is a historical parameter and does not predict the future. Furthermore, volume measures trading activity and does not directly indicate the direction in which a stock moves. Therefore, relying on one indicator is not good practice and a better approach could be to combine it with other sources of information to analyse a stock and assess its associated risks. In addition, developing a trading strategy that includes technical indicators and reviewing the performance and learnings of this strategy is more likely to lead to good results than relying only on a single indicator.
9. Other relevant articles on StoCoTo
Read more about the trade volume in The Big Manual
Other cumulative indicators are: A/D indicator, Volatility and OBV
Other technical indicators that make use of volume are: A/D indicator, MFI and OBV
#volume #tradingvolume #tradingvalue #technicalanalysis #technicalindicators #tradingsignals